

doi: 10.1167/9.1.14.
Perceptual and physiological evidence for a role for early visual areas in motion-induced blindness
Affiliations
- PMID: 19271884
- PMCID: PMC2654591
- DOI: 10.1167/9.1.14
Item in Clipboard
Perceptual and physiological evidence for a role for early visual areas in motion-induced blindness
J Vis.
.
Abstract
Visual disappearance illusions, such as motion-induced blindness, are commonly used to study the neural correlates of visual perception. In such illusions a salient visual target becomes perceptually invisible. Previous studies are inconsistent regarding the role of early visual areas in these illusions. Here we provide physiological and psychophysical evidence suggesting a role for early visual areas in generating motion-induced blindness, and we provide a conceptual model by which different brain areas might contribute to the perceptual disappearance in this illusion.
Figures
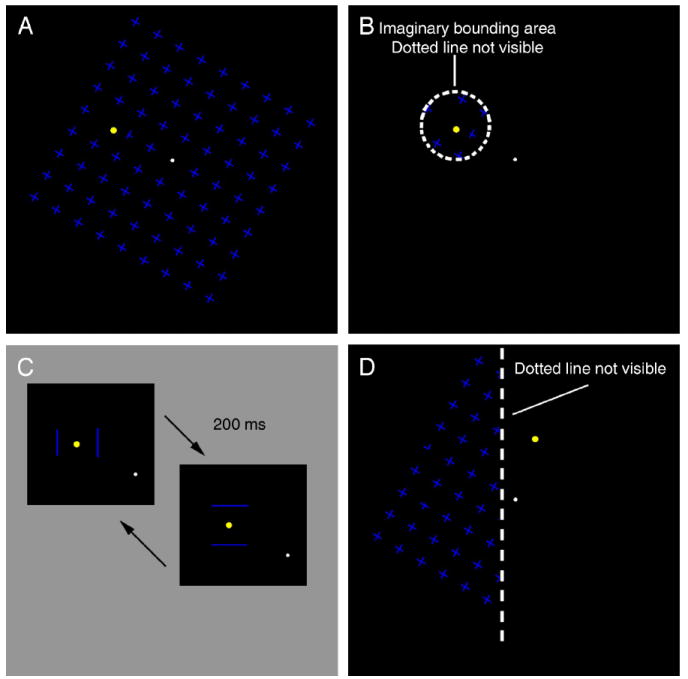
Visual stimuli used in Experiments 1A and 1B. (A) Full-field mask, a 9 × 9 field composed of 81 equally spaced blue crosses rotated around a fixation spot at 0.25 revolutions/s. A yellow target was located 2° from fixation in the top-left quadrant, as shown. (B) Local mask. This was the same stimulus as the full-field mask (A) except that the mask was restricted to an annulus with an outer radius of 0.8° centered on the yellow target. (C) Flashing bars. The target was the same as in A, but the mask was replaced by two pairs of sequentially flashing bars, flanking the target alternately horizontally or vertically. The two pairs alternated at 5 Hz. (D) Stimulus used in Experiment 1B, midline condition. Here the mask was present only to the left of an imaginary line 1° to the left of the target; in comparison conditions the fixation spot was moved by 1° or 2° to the right or left of this imaginary line (for detailed descriptions see Methods).
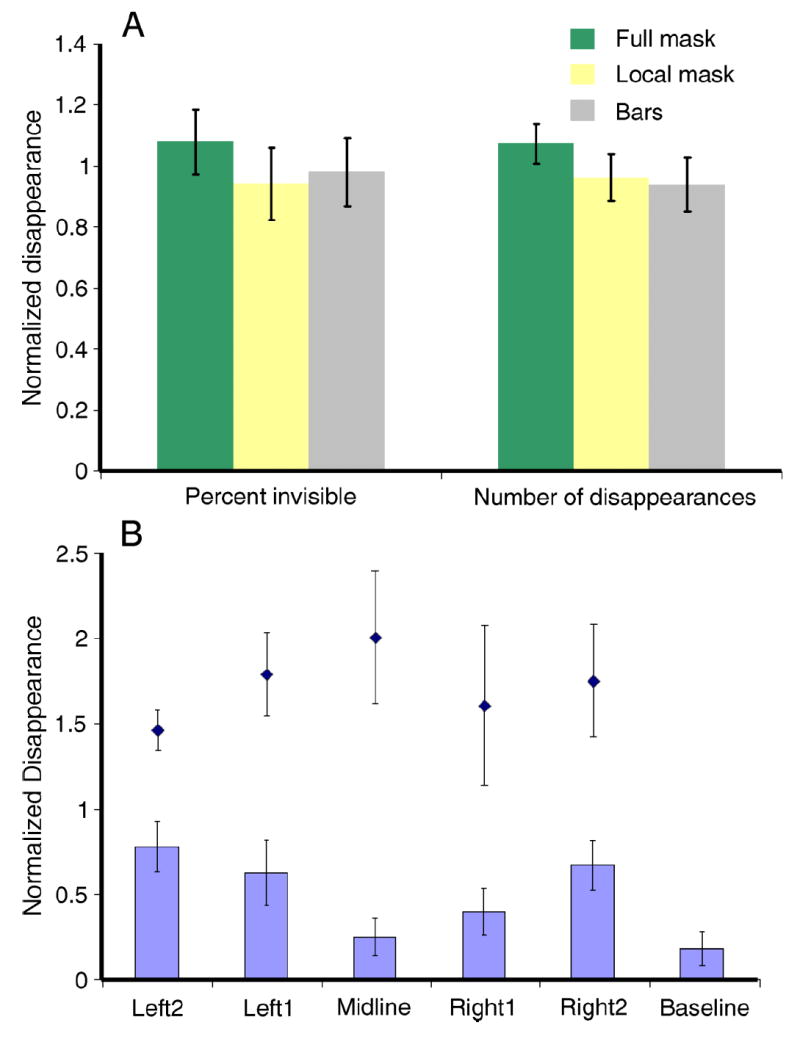
Results of Experiment 1. (A) Average of normalized (to average under all 3 conditions) time of invisibility (left) and number of disappearances (right) under Full Mask (green), Local Mask (yellow) and Flashing Bars (gray). (B) Reduced masking when target and mask are in different hemifields. Midline stimulus is shown in Figure 1D. Black diamonds show the average normalized disappearances for the full-mask control condition when the target was at the same locations as used to test the same vs. different hemifield conditions. Data are normalized to the average of the 11 conditions (5 with partial mask, 5 with full mask and one without a mask). Error bars represent the standard error.
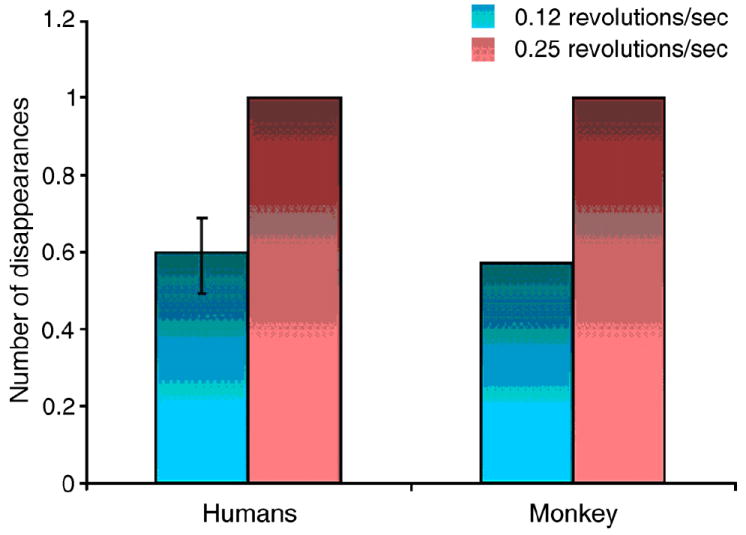
Effect of mask speed on the rates of disappearance for three human subjects and a trained monkey during MIB. All values are normalized to the high-speed (0.25 revolutions/sec) condition for each subject. Error bar in humans is the standard error (for the monkey there are no error bars because we had only one subject).
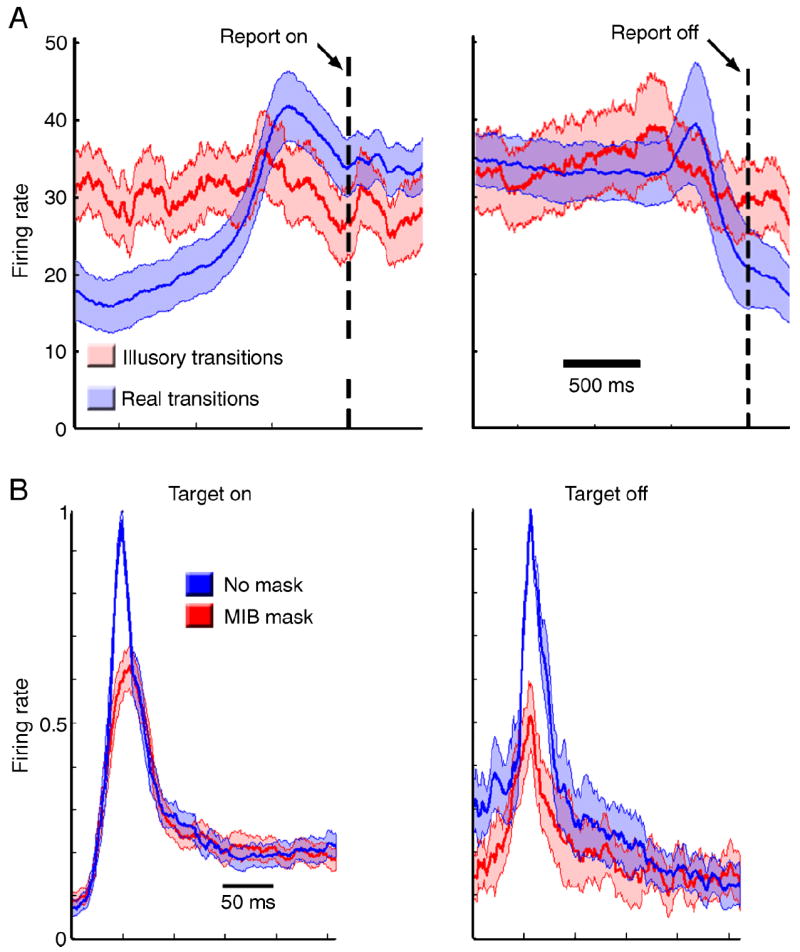
Results of Experiment 2. (A) Average responses of V1 cells when the monkey reported target appearance (left) and target disappearance (right) for illusory (red) or real (blue) transitions. Activity is aligned with the time of lever press, indicated by the dotted line. The shaded area denotes standard error. (B) Population average of V1 cells during passive fixation (mean ± standard error) to target ON (left) and target OFF (right) from cells with ON and OFF responses respectively. The blue line represents the average firing rate when no mask was present and red the average firing rate when the MIB mask was present. Responses were aligned by time to peak and normalized by the maximum firing rate for each cell.
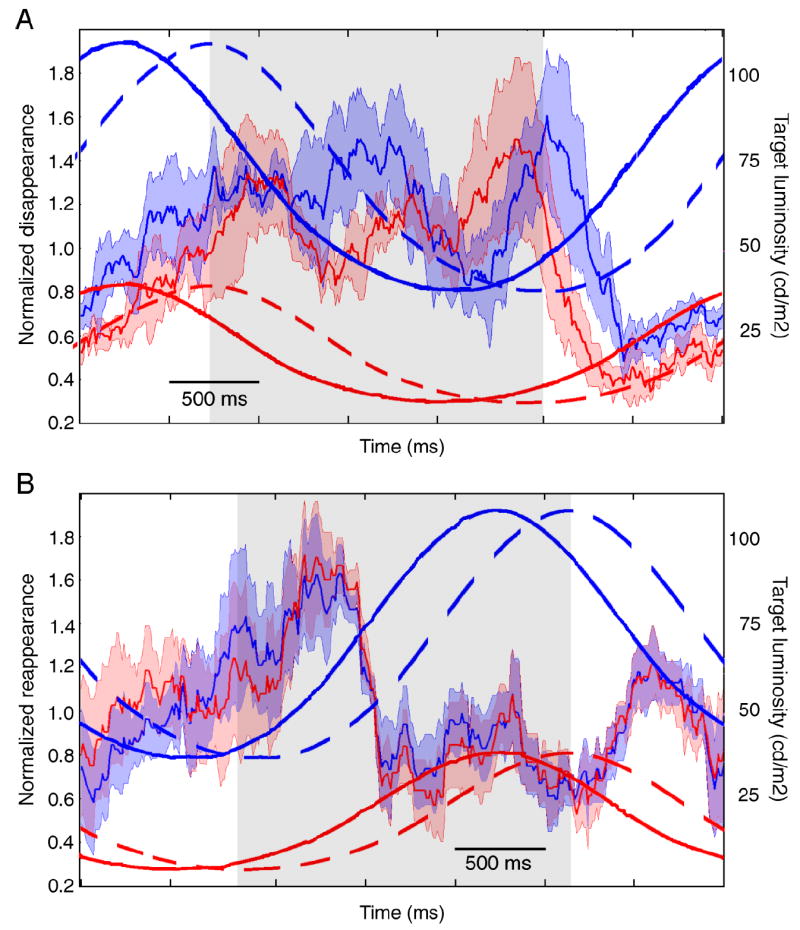
Results of Experiment 3. Normalized time of disappearance (A) and reappearance (B) as a function of time in the luminance cycle. The normalized time of disappearance was calculated as the percent of times the target disappeared in a 250 ms window around each time point, normalized to the average disappearance rate for each subject over the entire experiment. The irregular red and blue traces show the average normalized disappearance rate for the low (red) and high (blue) luminance cycles. The lighter red and blue shading denotes 1 standard deviation around the mean. The overlaid solid sinusoidal traces show the luminosity of the target during the cycle for the low (red) and high (blue) luminance cycles. The overlaid dotted sinusoidal traces show the luminosity of the target shifted in time by the average reaction time for all subjects (315 ms for appearances and 380 ms for disappearances) for the low (red) and high (blue) luminance conditions. Gray shaded areas show the time during which the target was decreasing in luminance (A) and increasing in luminance (B) once reaction times are accounted for.
References
-
- Bonneh YS, Cooperman A, Sagi D. Motion-induced blindness in normal observers. Nature. 2001;411:798–801. - PubMed
-
- Brainard DH. The Psychophysics Toolbox. Spatial Vision. 1997;10:433–436. - PubMed
-
- Funk AP, Pettigrew JD. Does interhemispheric competition mediate motion-induced blindness? A transcranial magnetic stimulation study. Perception. 2003;32:1325–1338. - PubMed
-
- Graf EW, Adams WJ, Lages M. Modulating motion-induced blindness with depth ordering and surface completion. Vision Research. 2002;42:2731–2735. - PubMed
-
- Hofstoetter C, Koch C, Kiper DC. Motion-induced blindness does not affect the formation of negative afterimages. Conscious Cognitive. 2004;13:691–708. - PubMed
Publication types
MeSH terms
Grants and funding
LinkOut - more resources
Full Text Sources
