. 2009 Feb 12;9(2):15.1-18.
doi: 10.1167/9.2.15.

The chromatic input to cells of the magnocellular pathway of primates

Affiliations

The chromatic input to cells of the magnocellular pathway of primates

Barry B Lee et al. J Vis. .

Abstract

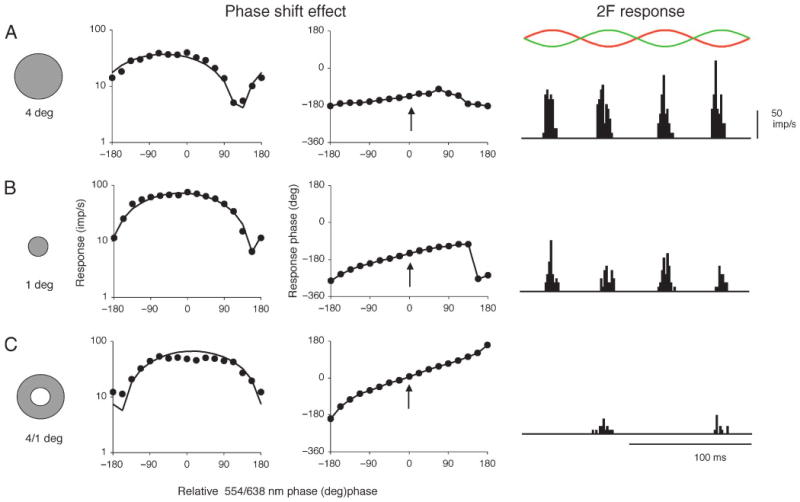
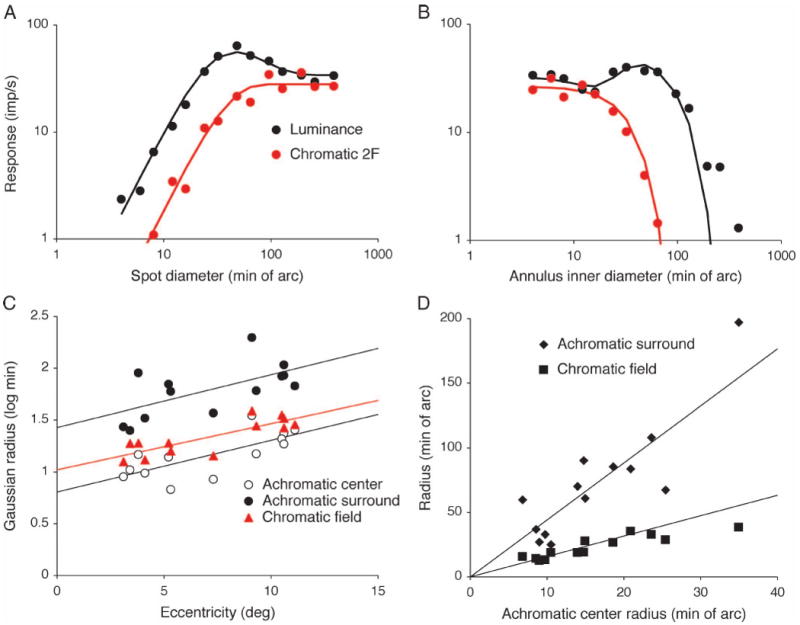
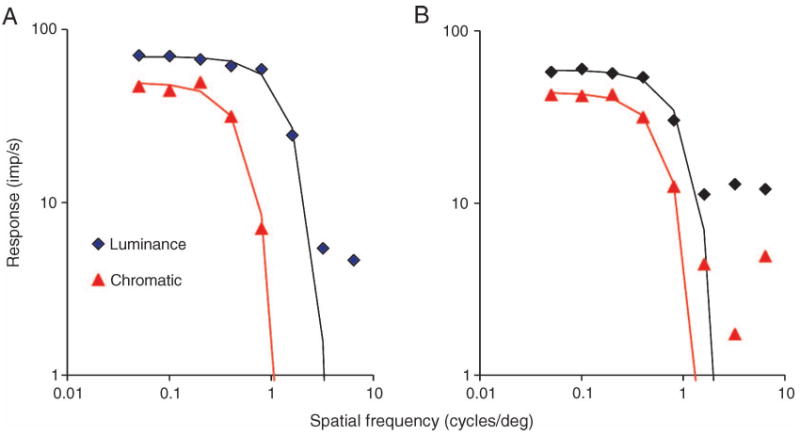
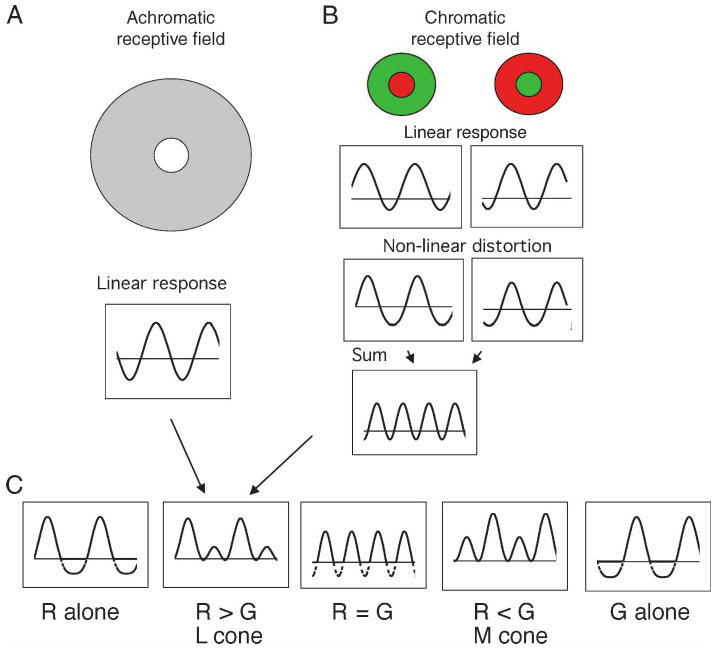
Parasol ganglion cells of the magnocellular (MC) pathway form the physiological substrate of a luminance channel underlying photometric tasks, but they also respond weakly to red-green chromatic modulation. This may take the form of a first-harmonic (1F) response to chromatic modulation at low temporal frequencies, and/or a second-harmonic (2F) response that is more marked at higher frequencies. It is shown here that both these responses originate from a receptive field component that is intermediate in size between center and surround, i.e., a discrete, chromatic receptive field is superimposed upon an achromatic center-surround structure. Its size is similar to the receptive field (center plus surround) of midget, parvocellular cells from the same retinal eccentricity. A 2F MC cell chromatic response component is shown to be present under cone silent substitution conditions, when only the middle- (M) or long-wavelength (L) cone is modulated. This and other features suggest it is a rectified response to a chromatic signal rather than a consequence of non-linear summation of M- and L-cone signals. A scheme is presented which could give rise to such responses. It is suggested that this chromatic input to MC cells can enhance motion signals to red-green borders close to equiluminance.


Figures

Figure 1
Figure 1
(A) A simple model by which a 2F chromatic response might be generated. Cone signals generated by the red and green stimulus waveforms in the top row show saturation. We assume these hypothetical signals, shown in the second row, are prior to the bipolar cells, so the cone response is hyperpolarizing. This model predicts a 2F chromatic response, but no major 2F distortions for silent substitution conditions. (B) Since such distortions were present, a more complex model was required to account for the data. The model is schematically indicated here and discussed in more detail in the Results section.
Figure 2
Figure 2
Responses of a parafoveal MC cell to phase paradigm and to chromatic, |M – L| modulation. For phase paradigm (phase shift effect), 638 and 554 nm light sources were modulated at different relative phases. Response amplitude (1st harmonic) and phase are shown (1.22 Hz, 50% LED modulation, mean of 8 cycles). The response minimum is shifted away from ±180°. The solid lines show a fit of a rectified cosine function. The shift is marked with a 4° field (A) but less with a 1° field (B). However, a surround annulus (C) (note 180° phase shift in achromatic response, which is arrowed, for surround condition) fails to evoke a shift. With 638–554 nm chromatic modulation (2F response; 10 Hz, 64 cycles averaged for histograms) there is a response at twice the stimulus frequency (waveforms sketched above). This is strong with a 4° field (A) but less with a 1° field (B), and absent with an annulus. These data are consistent with a chromatic input of intermediate size between achromatic center and surround.
Figure 3
Figure 3
Area summation curves for the different response components. Response amplitude for modulated spots (A) or annuli (B) for a representative MC cell. Luminance (30% contrast) or |M – L| chromatic modulation responses (30% RMS cone contrast, R/G ratio adjusted to each cell's 1st harmonic null) are shown. 5 Hz modulation, 32 cycles. Amplitude and phase (not shown) were fitted as described in the text (solid lines). Free parameters of interest are achromatic center and surround sizes (σc, σs) and size of the chromatic field (σchr) generating the 2F response. (C, D) These parameters (σc, σs, σchr) are plotted against eccentricity in C for an MC cell sample and fitted with the linear relations shown. The 2F chromatic response field (σchr) is of intermediate size to achromatic center (σc) and surround (σs). (D) Size of achromatic surround (σs) and chromatic 2F field (σchr) plotted against achromatic center radius (σs), with linear regression lines. Data are again consistent with a mechanism larger than the achromatic center (σc) but smaller than the achromatic surround (σs).
Figure 4
Figure 4
Area summation of PC cells with chromatic spots (5 Hz, red-green modulation ∼27% RMS contrast for L and M cones). (A) Response amplitude (1F response) rises to a plateau. Center and surround responses reinforce one another, so the plateau diameter reflects total receptive field size, center plus surround. Data were fitted with a single cumulative Gaussian, since separate center and surround contributions were seldom apparent. (B) Gaussian radii of PC cells' receptive fields (center plus surround) and MC cells' chromatic fields (replotted with regression line from Figure 3) overlap.
Figure 5
Figure 5
Response histograms of MC on-center cell to 626/508 nm borders with differing luminance contrasts (average of 20 sweeps). In upper row and lower rows (A, B) the direction of chromatic contrast is reversed. The on-center cell shows an excitatory response to a luminance increment edge. To the equiluminant edge there is a response to both directions of chromatic contrast. Solid lines show fits of a Gaussian function. (C) Plot of chromatic vs. achromatic radius fit values. Most points can be seen to lie above the unity ratio line. Data are consistent with a chromatic response from a mechanism somewhat larger than the achromatic field center.
Figure 6
Figure 6
Spatial frequency tuning curves for two MC cells for the 2F chromatic response and the achromatic response. Both were acquired at constant modulation contrast (achromatic 30%, chromatic ∼27% RMS contrast for the M and L cones; temporal frequency 5 Hz, averaged over 32 sweeps). In the examples shown, the achromatic tuning curves show little low spatial frequency attenuation. The high spatial frequency cut-off is lower for chromatic modulation.
Figure 7
Figure 7
Spatial summation of 1F achromatic and 2F chromatic components. Spatial nonlinearities in cat Y cells result in a 2F response to counterphase modulation of gratings symmetrically positioned about the receptive field center, which has been attributed to a subunit structure. With counterphase modulation of chromatic gratings, a null could be found which indicates that the non-linear response is not due to a subunit structure. (A, B) Amplitude and phase of responses of two MC cells to counterphase modulation (0.2 cpd, 4.88 Hz) of achromatic (30% contrast) and red-green chromatic gratings (27% RMS contrast for M and L cones). For the achromatic gratings, there is a 1st harmonic response minimum and phase reversal at 2 phase loci, with little 2nd harmonic response. This is consistent with linear spatial summation. For the 2F chromatic response, there are minima close to the minima for achromatic modulation. 2F phase is not affected. These data are consistent with linear spatial summation within chromatic mechanisms prior to nonlinear summation.
Figure 8
Figure 8
1F and 2F responses of a MC cells as a function of modulation direction in an M,L color space at different temporal frequencies. (A) Sketch of cone modulation for luminance modulation, chromatic modulation, and the silent substitution conditions. (B) Response of an MC on-center cell to different conditions (9.8 Hz; mean RMS contrast for M, L cones 30%). For the response to luminance modulation the 1st harmonic dominates. For the other conditions, there is a marked 2F component, even for the silent substitution conditions. This indicates that the 2F component is not due to a simple non-linearity of cone summation. (C–E) 1F and 2F response components as a function of modulation direction in L,M cone space at three frequencies as indicated. Mean cone contrast was held constant for each condition. The 1F response is maximum to luminance modulation and minimum to chromatic modulation. At 2.4 and 9.8 Hz, the 2F response is minimum to luminance modulation, marked to the silent substitution conditions and maximum to chromatic modulation.
Figure 9
Figure 9
(A) Non-linearity index (a measure of response distortion; see text) for a sample of MC cells (n = 16, on- and off-center cells combined) as a function of direction of modulation in an M, L cone space at 3 frequencies. At 2.4 and 9.8 Hz, the index is minimal for luminance modulation but increases as the axis of modulation moves toward the silent substitution directions, and is maximal in the chromatic quadrant. At 26 Hz, most response distortions were associated with response rectification. (B) Response of a PC cell to 2.4 Hz modulation in L, M space. There is a response minimum to luminance modulation and maximum response to chromatic modulation.
Figure 10
Figure 10
Amplitude and phase of 1F and 2F responses of on- and off-center cells (2.5 Hz drifting gratings, 0.2 cpd). (A) Stimulus waveforms for three modulation conditions, modulation of red light alone (R alone), green light alone (G alone) and counterphase condition. (B) Two possible response phases; 2F responses could line up with the peaks of the 1F responses, or be at 90° to this value. (C–D) Responses of on- and off-center MC cells to the three conditions, and to intermediate conditions corresponding to modulation of the L and M cone alone (20 sweeps, 64 bins/sweep). The peaks of the 2F response tend to line up with the peaks of the luminance response. Vertical lines have been drawn in C, D to illustrate this. The on-center cell displays a 2F response to the silent substitution conditions. The 2F response of the off-center cell is of smaller magnitude. E. Amplitude and phase of 1F and 2F components as a function of R/G gun modulation luminance ratio. 2.5 Hz, 20 sweeps. 1F responses go through a minimum close to a ratio of 1, where 2F ratios are maximal. 1F phases go through a reversal close to a ratio of 1. 2F ratios converge to similar values around 1.
Figure 11
Figure 11
A scheme as to how the 2F response may be generated. An achromatic receptive field yields a 1F response to sinusoidal modulation. (The example shown for the upper panels is that expected for L cone modulation alone.) Two chromatic receptive fields of opposite cone polarities (+L − M and +M − L) yield responses in counterphase. An accelerating (squaring) nonlinearity is applied to these waveforms; the resulting sum shows a 2F response. When added to the achromatic response in different conditions (lower panels), the pattern of responses seen is similar to that observed empirically. Rectification of response histograms has been indicated by dashed lines for negative firing rates.

References

    1. Blakemore C, Vital-Durand F. Organization and post-natal development of the monkey's lateral geniculate nucleus. The Journal of Physiology. 1986;380:453–491. - PMC - PubMed
    1. Cavanagh P, Anstis S. The contribution of color to motion in normal and color-deficient observers. Vision Research. 1991;31:2109–2148. - PubMed
    1. Cavanagh P, Favreau OE. Color and luminance share a common motion pathway. Vision Research. 1985;25:1595–1601. - PubMed
    1. Chen Y, Martinez-Condez S, Macknik S, Swadlow H, Alonso JM, Lee B. Input to cells in macaque V1 revealed with a novel grating stimulus [Abstract] Journal of Vision. 2007. p. 57.p. 57a. http://journalofvisionorg/7/15/57/ - DOI
    1. Croner LJ, Kaplan E. Receptive fields of P and M ganglion cells across the primate retina. Vision Research. 1995;35:7–24. - PubMed

Publication types