

Dihydroartemisinin (DHA) induces caspase-3-dependent apoptosis in human lung adenocarcinoma ASTC-a-1 cells
- PMID: 19272183
- PMCID: PMC2653522
- DOI: 10.1186/1423-0127-16-16
Dihydroartemisinin (DHA) induces caspase-3-dependent apoptosis in human lung adenocarcinoma ASTC-a-1 cells
Abstract
Background: Dihydroartemisinin (DHA), a semi-synthetic derivative of artemisinin, isolated from the traditional Chinese herb Artemisia annua, is recommended as the first-line anti-malarial drug with low toxicity. DHA has been shown to possess promising anticancer activities and induce cancer cell death through apoptotic pathways, although the molecular mechanisms are not well understood.
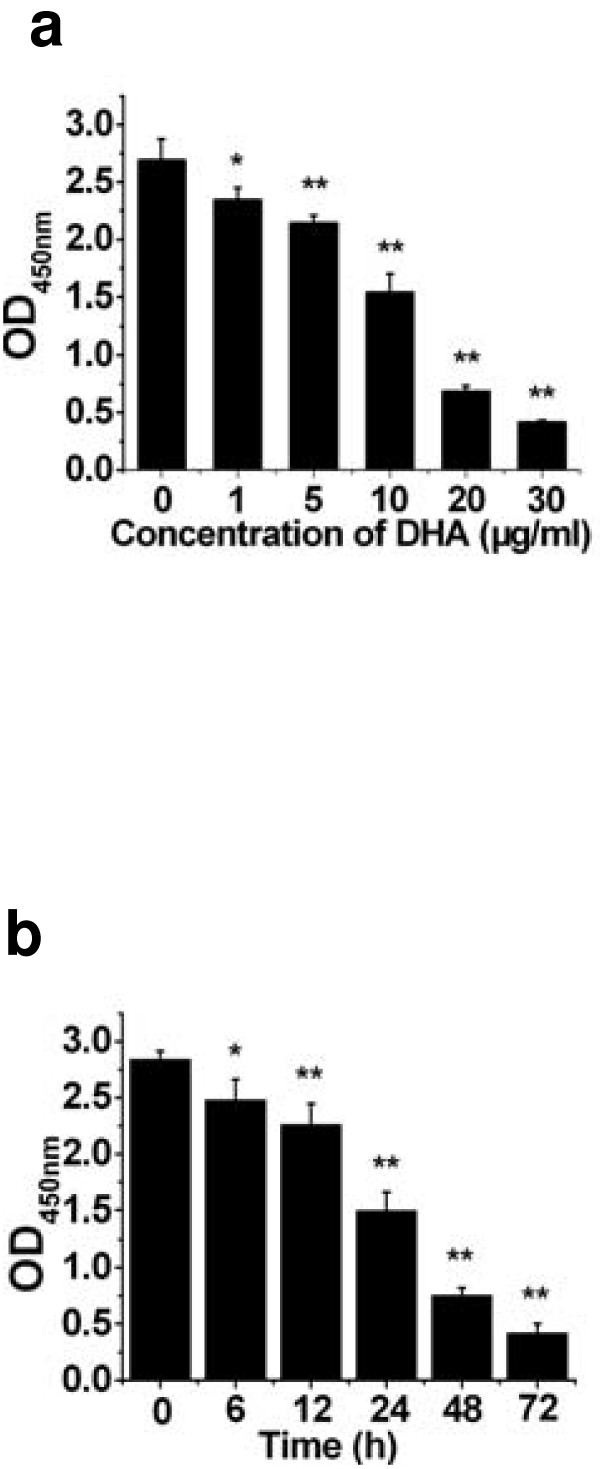
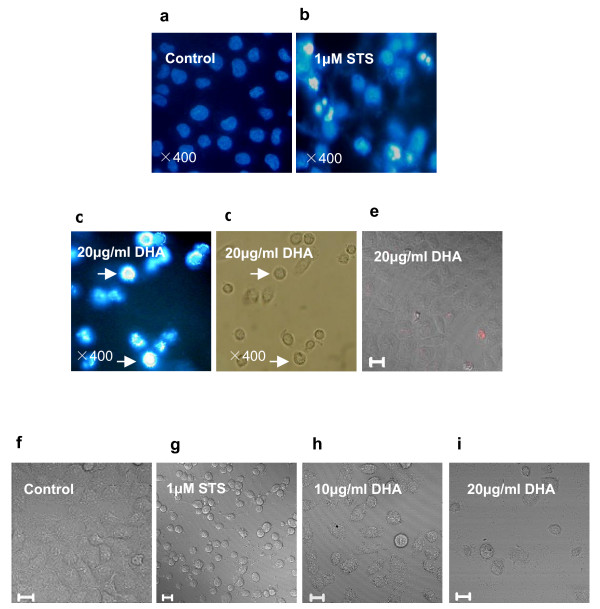
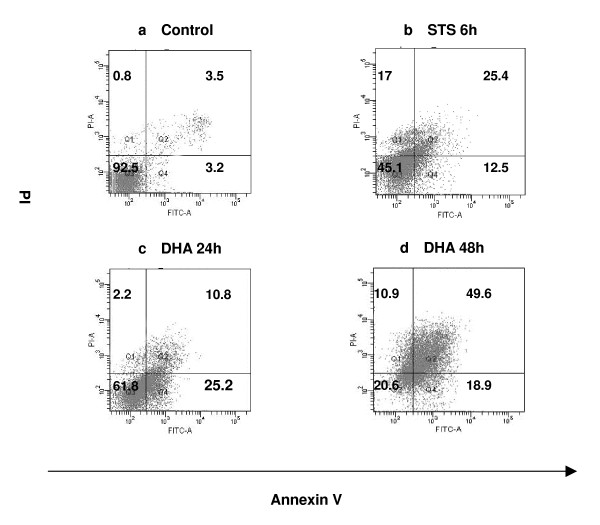
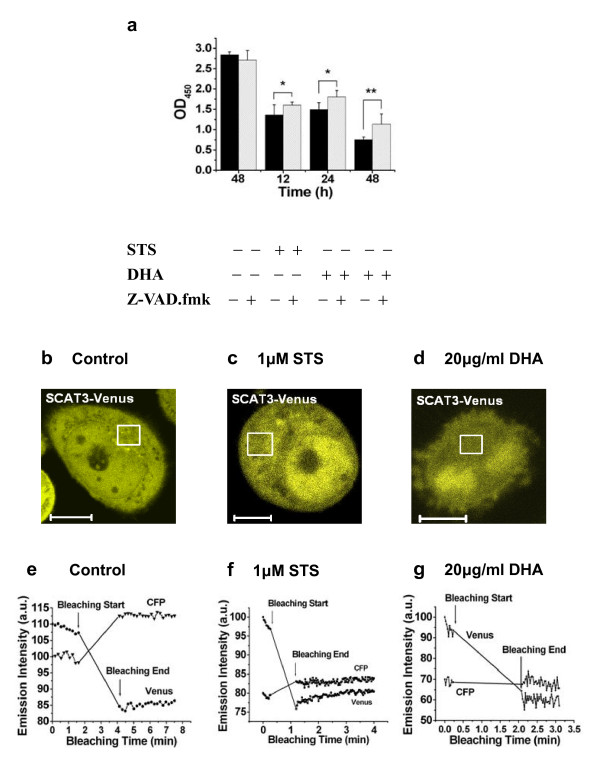
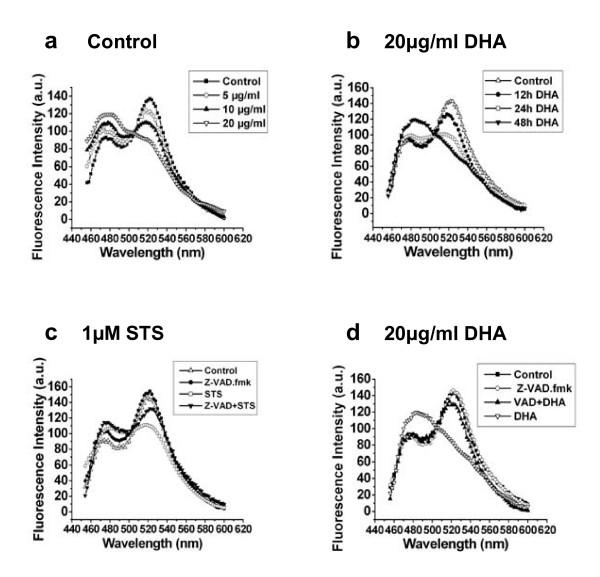
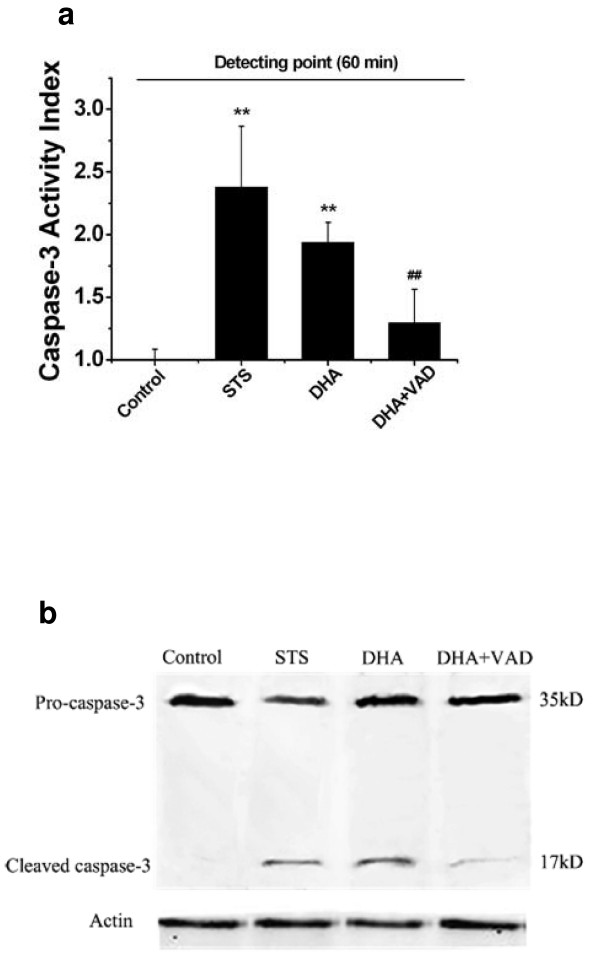
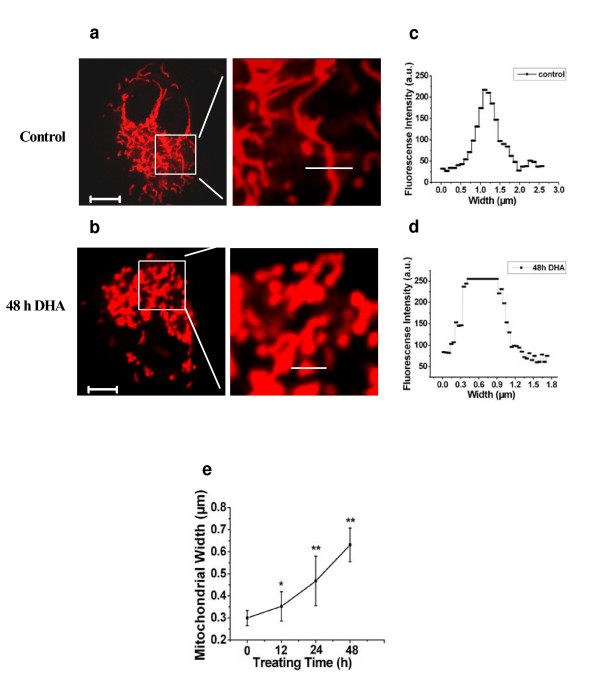
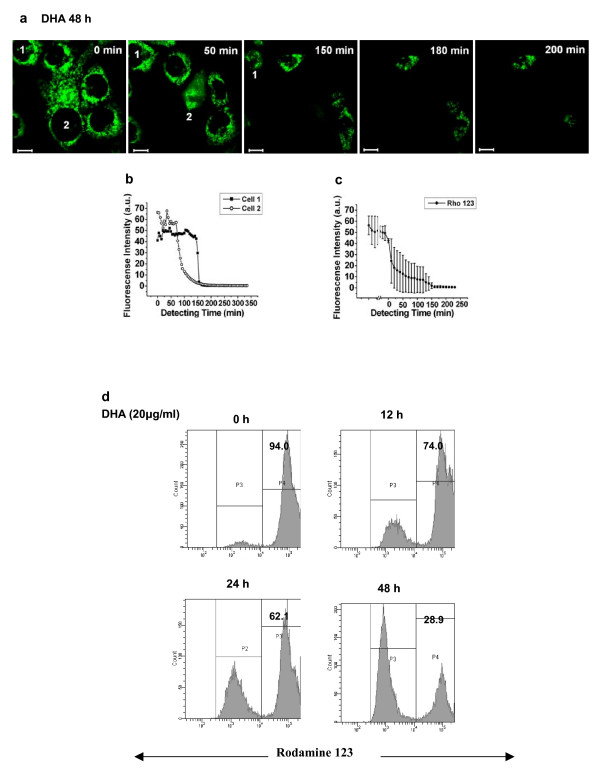
Methods: In this study, cell counting kit (CCK-8) assay was employed to evaluate the survival of DHA-treated ASTC-a-1 cells. The induction of apoptosis was detected by Hoechst 33258 and PI staining as well as flow cytometry analysis. Collapse of mitochondrial transmembrane potential (DeltaPsim) was measured by dynamic detection under a laser scanning confocal microscope and flow cytometry analysis using Rhodamine123. Caspase-3 activities measured with or without Z-VAD-fmk (a broad spectrum caspase inhibitor) pretreatment by FRET techniques, caspase-3 activity measurement, and western blotting analysis.
Results: Our results indicated that DHA induced apoptotic cell death in a dose- and time-dependent manner, which was accompanied by mitochondrial morphology changes, the loss of DeltaPsim and the activation of caspase-3.
Conclusion: These results show for the first time that DHA can inhibit proliferation and induce apoptosis via caspase-3-dependent mitochondrial death pathway in ASTC-a-1 cells. Our work may provide evidence for further studies of DHA as a possible anticancer drug in the clinical treatment of lung adenocarcinoma.
Figures
Similar articles
-
Single-cell analysis of dihydroartemisinin-induced apoptosis through reactive oxygen species-mediated caspase-8 activation and mitochondrial pathway in ASTC-a-1 cells using fluorescence imaging techniques.J Biomed Opt. 2010 Jul-Aug;15(4):046028. doi: 10.1117/1.3481141. J Biomed Opt. 2010. PMID: 20799830
-
Curcumin induces mitochondria pathway mediated cell apoptosis in A549 lung adenocarcinoma cells.Oncol Rep. 2010 May;23(5):1285-92. doi: 10.3892/or_00000762. Oncol Rep. 2010. PMID: 20372842
-
Curcumol induces apoptosis via caspases-independent mitochondrial pathway in human lung adenocarcinoma ASTC-a-1 cells.Med Oncol. 2011 Mar;28(1):307-14. doi: 10.1007/s12032-010-9431-5. Epub 2010 Feb 3. Med Oncol. 2011. PMID: 20127426
-
Dihydroartemisinine enhances dictamnine-induced apoptosis via a caspase dependent pathway in human lung adenocarcinoma A549 cells.Asian Pac J Cancer Prev. 2013;14(10):5895-900. doi: 10.7314/apjcp.2013.14.10.5895. Asian Pac J Cancer Prev. 2013. PMID: 24289596
-
Dihydroartemisinin: A Potential Natural Anticancer Drug.Int J Biol Sci. 2021 Jan 16;17(2):603-622. doi: 10.7150/ijbs.50364. eCollection 2021. Int J Biol Sci. 2021. PMID: 33613116 Free PMC article. Review.
Cited by
-
Inhibition of urokinase-type plasminogen activator expression by dihydroartemisinin in breast cancer cells.Oncol Lett. 2014 May;7(5):1375-1380. doi: 10.3892/ol.2014.1918. Epub 2014 Feb 27. Oncol Lett. 2014. PMID: 24765140 Free PMC article.
-
Artemisiae Annuae Herba: from anti-malarial legacy to emerging anti-cancer potential.Theranostics. 2025 Jun 20;15(15):7346-7377. doi: 10.7150/thno.115414. eCollection 2025. Theranostics. 2025. PMID: 40756346 Free PMC article. Review.
-
The synergistic effects of traditional Chinese herbs and radiotherapy for cancer treatment.Oncol Lett. 2013 May;5(5):1439-1447. doi: 10.3892/ol.2013.1245. Epub 2013 Mar 12. Oncol Lett. 2013. PMID: 23760551 Free PMC article.
-
Comparison of the cytotoxic effects of different fractions of Artemisia ciniformis and Artemisia biennis on B16/F10, PC3 and MCF7 Cells.Res Pharm Sci. 2020 Jul 3;15(3):273-280. doi: 10.4103/1735-5362.288434. eCollection 2020 Jun. Res Pharm Sci. 2020. PMID: 33088327 Free PMC article.
-
Artesunate inhibits cell proliferation and decreases growth hormone synthesis and secretion in GH3 cells.Mol Biol Rep. 2012 May;39(5):6227-34. doi: 10.1007/s11033-011-1442-6. Epub 2012 Jan 5. Mol Biol Rep. 2012. PMID: 22215215
References
-
- Weir HK, Thun MJ, Hankey BF. Annual report to the nation on the status of cancer 1975-2000, featuring the uses of surveillance data for cancer prevention and control. J Natl Cancer Inst. 2003;95:1276–1299. - PubMed
-
- Breathnach OS, Freidlin B, Conley B. Twenty-two years of phase III trials for patients with advanced non-small-cell lung cancer: sobering results. Journal of Clinical Oncology. 2001;19:1734–1742. - PubMed
Publication types
MeSH terms
Substances
LinkOut - more resources
Full Text Sources
Other Literature Sources
Research Materials
Miscellaneous
