Review
. 2009 May 25;97(2):213-28.
doi: 10.1016/j.physbeh.2009.02.032. Epub 2009 Mar 9.

Sex differences and reproductive hormone influences on human odor perception

Affiliations
Review

Sex differences and reproductive hormone influences on human odor perception

Richard L Doty et al. Physiol Behav. .

Erratum in

  • Physiol Behav. 2009 Oct 19;98(4):517

Abstract

The question of whether men and women differ in their ability to smell has been the topic of scientific investigation for over a hundred years. Although conflicting findings abound, most studies suggest that, for at least some odorants, women outperform men on tests of odor detection, identification, discrimination, and memory. Most functional imaging and electrophysiological studies similarly imply that, when sex differences are present, they favor women. In this review we examine what is known about sex-related alterations in human smell function, including influences of the menstrual cycle, pregnancy, gonadectomy, and hormone replacement therapy on a range of olfactory measures. We conclude that the relationship between reproductive hormones and human olfactory function is complex and that simple associations between circulating levels of gonadal hormones and measures of olfactory function are rarely present.


Figures

Figure 1
Figure 1
Percent of men and women correctly identifying, in a forced-choice four-alternative multiple-choice situation, 50 microencapsulated fragrances. From [71] with permission.
Figure 2
Figure 2
Median (interquartile range) scores on the University of Pennsylvania Smell Identification Test (UPSIT) as a function of sex and age. Note that females outperform males at all ages, despite a ceiling effect of the test in the younger years. From [185] with permission. Copyright © 1984 American Association for the Advancement of Science.
Figure 3
Figure 3
Mean (SD) scores the University of Pennsylvania Smell Identification Test (UPSIT) as a function of sex across the prepubertal, adolescent, and early adult years. From [79] with permission. Copyright © 1986, Macmillan Publishing Company, a division of Macmillan, Inc.
Figure 4
Figure 4
Odor Memory Test Scores as a function of sex and age. Curves represent quadratic fntions fitted by least squares. From [87] with permission. Copyright © 2003 Oxford University Press.
Figure 5
Figure 5
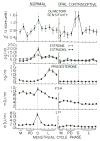
Patterns of changes in signal detection measures of olfactory sensitivity and plasma levels of five reproductive hormones across cycle phases of women taking and women not taking oral contraceptives. Data are normalized and assigned to cycle phases using the Doty [186] procedure. M = menstrual phases 1 and 2; PO = preovulatory phases 1–3; 0 = ovulatory phase (day of LH surge or day before LH surge in normally cycling group, day 13 or 14 in oral contraceptive group, where day 1 = 1st day of menses); L = luteal phases 1–5. Note clear fluctuation in olfactory sensitivity in both groups and the lack of correlation between these changes and circulating levels of pituitary and gonadal hormones in the oral contraceptive group. From [103] with permission. Copyright © 1982 IRL Press.
Figure 6
Figure 6
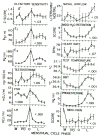
Mean (SEM) changes in 13 variables as a function of menstrual cycle phase in normally cycling women. E1 = estrone; E2 = estradiol; FSH = follicle stimulating hormone; LH = luteinizing hormone; MDQ = Moods Menstrual Distress Questionaire; BBT = basal body temperature; M = menstrual phase; O = ovulatory phase (day of LH surge or day before); PO = preovulatory phase; L = luteal phases. Phase designation establish by Doty’s (1979) procedure [108]. The p values refer to the cycle phase factor in one-way analyses of variance. Reprinted from [60] with permission. Copyright © 1981, American Psychological Association.
Figure 7
Figure 7
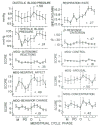
Mean (SEM) changes in 10 additional variables (see Figure 6) as a function of menstrual cycle phase in normally cycling women. MDQ = Moos Menstrual Distress Questionnaire. From [79] with permission. Copyright © 1986, Macmillan Publishing Company, a division of Macmillan, Inc.
Figure 8
Figure 8
Cluster of primary correlations among variables that most strongly loaded on Factor 1 of the principal components analysis of the data from the normally cycling women. FSH = follicle stimulating hormone. MDQ = Moos’ Menstrual Distress Questionnaire. From [79] with permission. Copyright © 1986, Macmillan Publishing Company, a division of Macmillan, Inc.
Figure 9
Figure 9
Cluster of primary correlations among variables that most strongly loaded on Factor 2 of the principal components analysis of the data from the normally cycling women. LH = luteinizing hormone; FSH = follicle stimulating hormone. From [79] with permission. Copyright © 1986, Macmillan Publishing Company, a division of Macmillan, Inc.
Figure 10
Figure 10
Cluster of primary correlations among variables that most strongly loaded on Factor 1 of the principal components analysis of the data from the women of the oral contraceptive group. FSH = follicle stimulating hormone. From [79] with permission. Copyright © 1986, Macmillan Publishing Company, a division of Macmillan, Inc.
Figure 11
Figure 11
Cluster of primary correlations among variables that most strongly loaded on Factor 2 of the principal components analysis of the data from the women of the oral contraceptive group. From [79] with permission. Copyright © 1986, Macmillan Publishing Company, a division of Macmillan, Inc.
Figure 12
Figure 12
Changes in nine variables across two consecutive menstrual cycles of a subject taking oral contraceptive medication. To diminish noise, a moving average with equal weights attached to three adjacent time points was applied to each series. Dark rectangles on the abcissae signify periods of menstrual bleeding; open rectangles, days during which the oral contraceptive medication was taken. Testing took place from 9:30 AM to noon each day. Pure-tone thresholds were averaged across a range of frequencies. From [103] with permission. Copyright © 1982 IRL Press, Ltd.
Figure 13
Figure 13
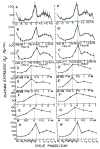
Mean (± SEM) plasma levels of 17β-estradiol for eight women across 14 cycles categorized by eight techniques. Raw (i.e., non-normalize) data is represented on left, and normalized data on the right. Normalization consisted of multiplying each daily measure from a given cycle by a factor that equated the arithmetic mean of all of the daily measure of that cycle to the grand arithmetic mean of the entire cycle day/cycle metrix. A, A′: Data plotted daily from LH surge; B, B′: Data plotted in two-day intervals from LH surge. C, C′: Data plotted in three-day intervals from LH surge. D, D′: Data categorized by the Spitz et al. [187] procedure. E, E′: Data categorized by a modified Spitz et al. [187] procedure. F, F′: Data categorized into successive sevenths of the cycle. G, G′: Data categorized by the Doty and Silverthorne [65] procedure. H, H′: Data categorized by the Doty [186] procedure. From [186] with permission. Copyright © 1979 by The Endocrine Society.
Figure 14
Figure 14
Basal body temperature (BBT) means (SD) plotted by day from the major LH surge. Based on 14 menstrual cycles of 8 health women ranging in age from 18 to 33 years [mean (SD) = 24.9 (4.8)]. Average cycle length = 27.4 days (range 23–33 days); mean duration of menses = 5.0 days (range: 3–7 days). The day of the major LH surge occurred, on average, 14.9 days (range: 11–21) from the onset of menstrual bleeding. Note the decrease in the number of cycles represented as the distance form the LH surge increases and the additional of menstrual cycle days as one moves from day -6 outward. From [79] with permission. Copyright © 1986, Macmillan Publishing Company, a division of Macmillan, Inc.

References

    1. Mobius PJ. The physiological mental weakness of women. Alien Neurol. 1901;22:624–42.
    1. Romanes RG. Mental differences between men and women. Nineteenth Century. 1887;21:654–72.
    1. Kimura D. Sex and cognition. Cambridge, MA; MIT Press: 1999.
    1. Halpern DF. Sex Differences in Cognitive Abilities. New York: Lawrence Erlbaum; 2000.
    1. McGuinness D. Sex differences in the organization of perception and cognition. In: Lloyd B, Archer J, editors. Exploring Sex Differences. London: Academic Press; 1976.

Publication types

Substances