. 2009 Jun 4;8(6):704-19.
doi: 10.1016/j.dnarep.2009.01.021. Epub 2009 Mar 9.

Novel DNA mismatch-repair activity involving YB-1 in human mitochondria

Affiliations

Novel DNA mismatch-repair activity involving YB-1 in human mitochondria

Nadja C de Souza-Pinto et al. DNA Repair (Amst). .

Abstract

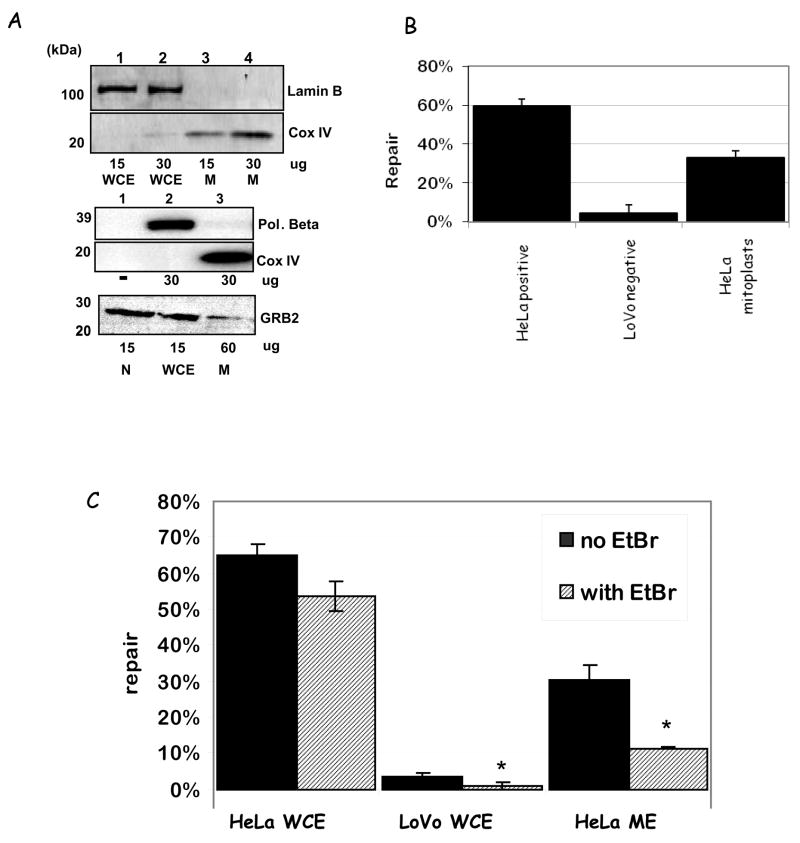
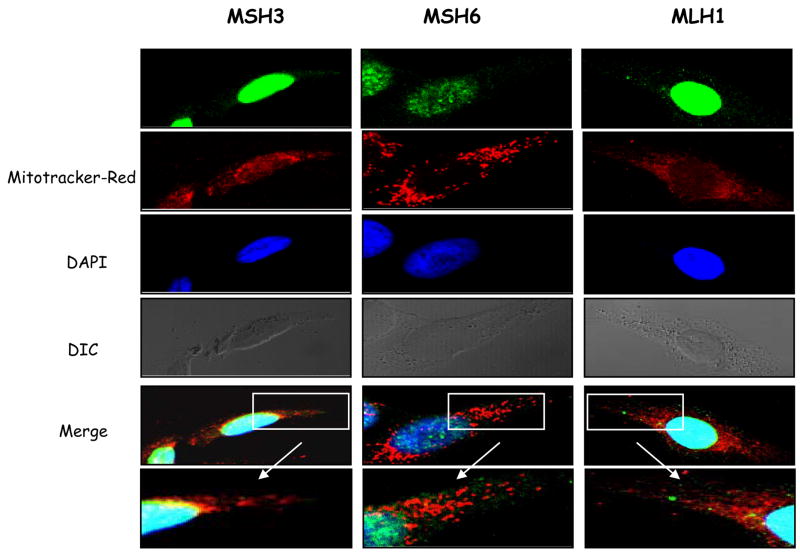
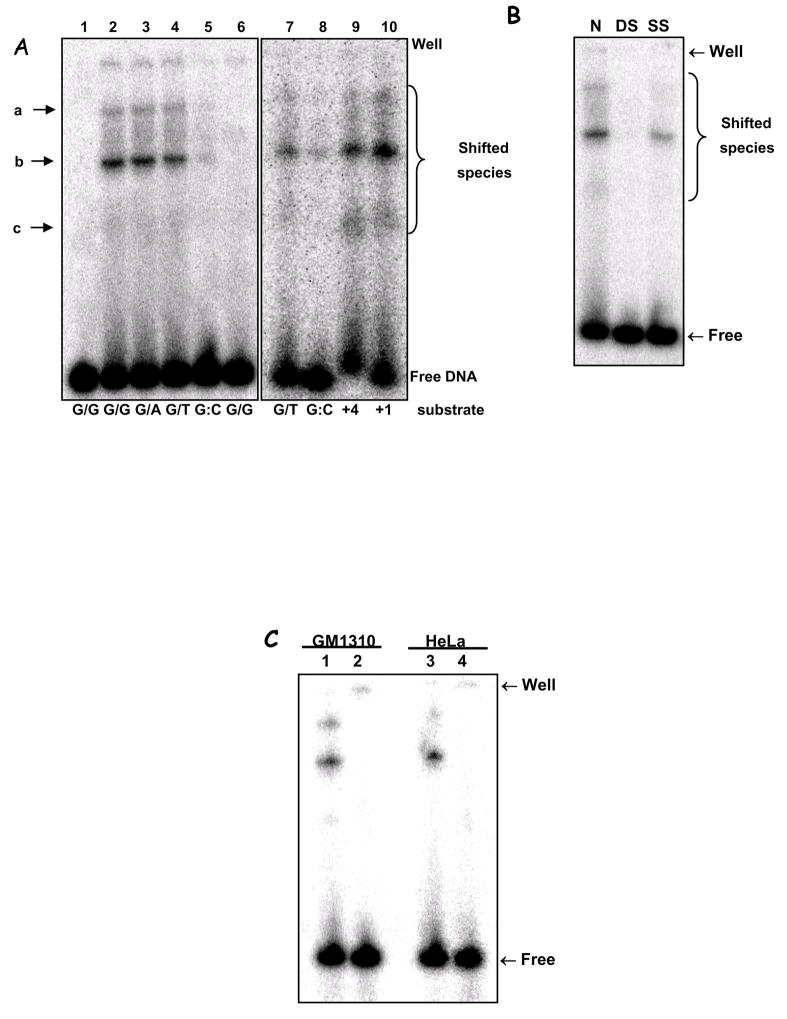
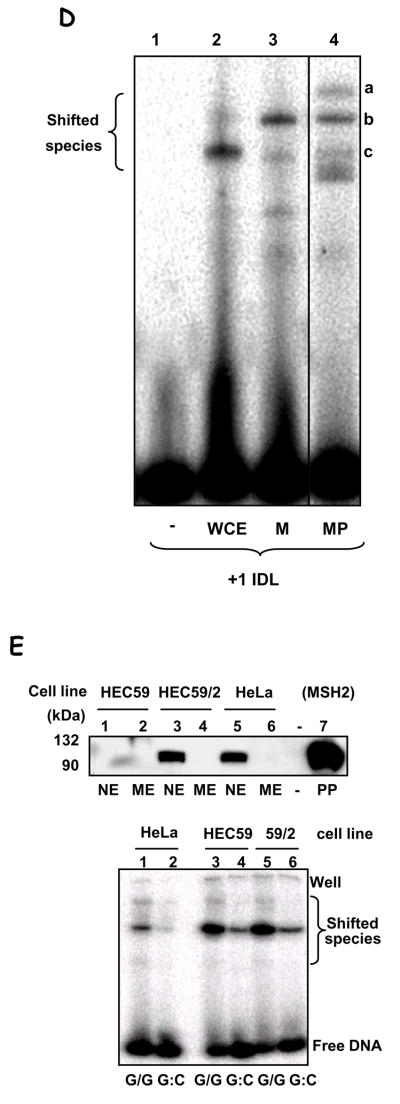
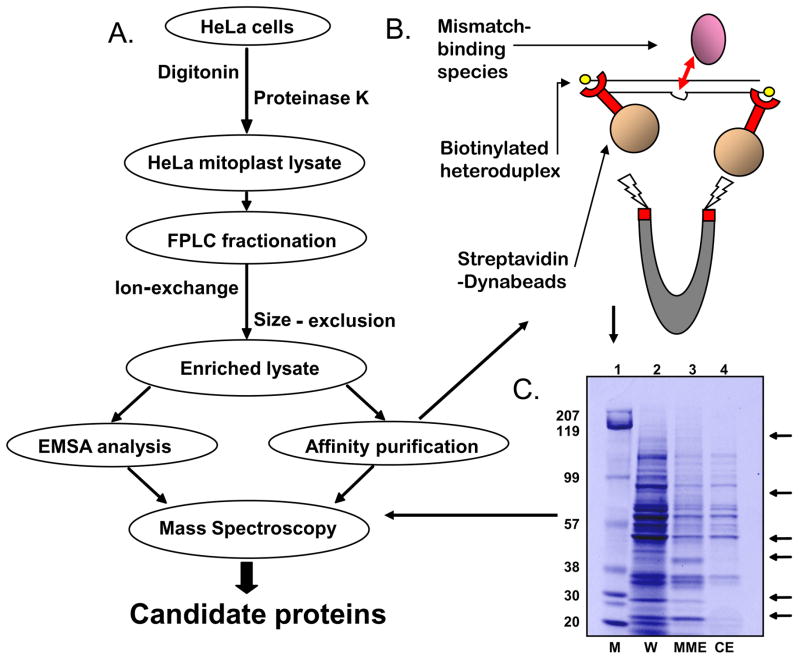
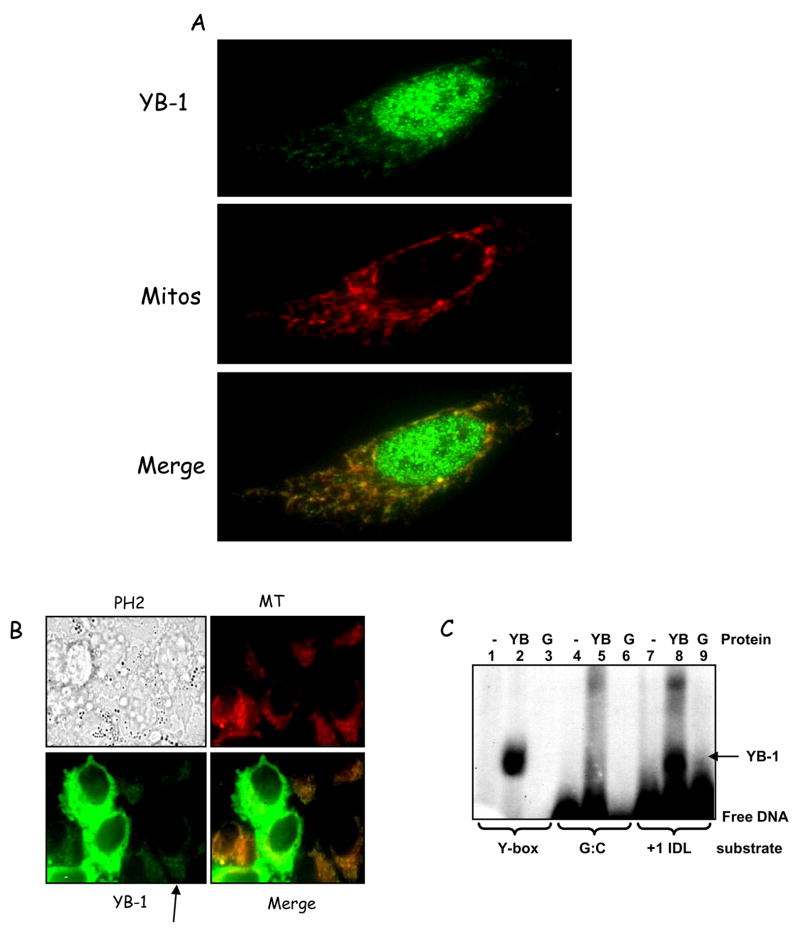
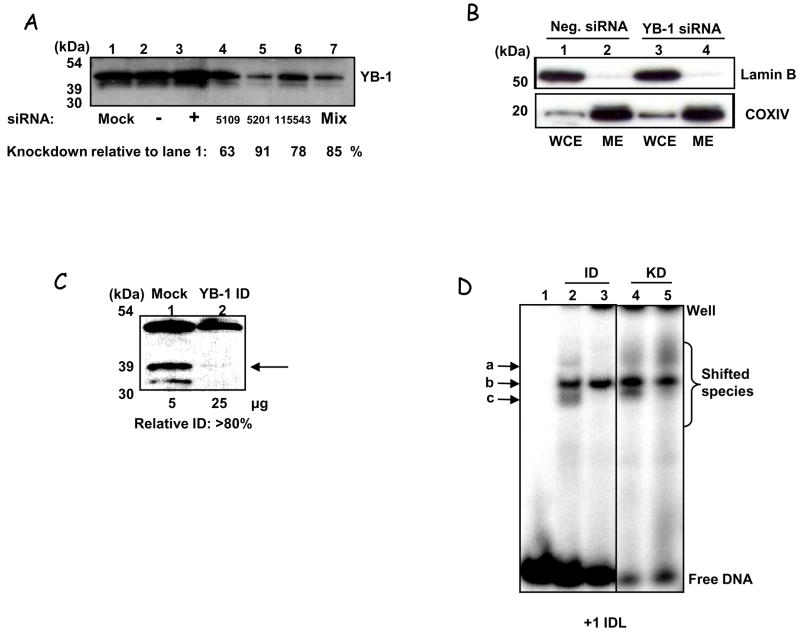
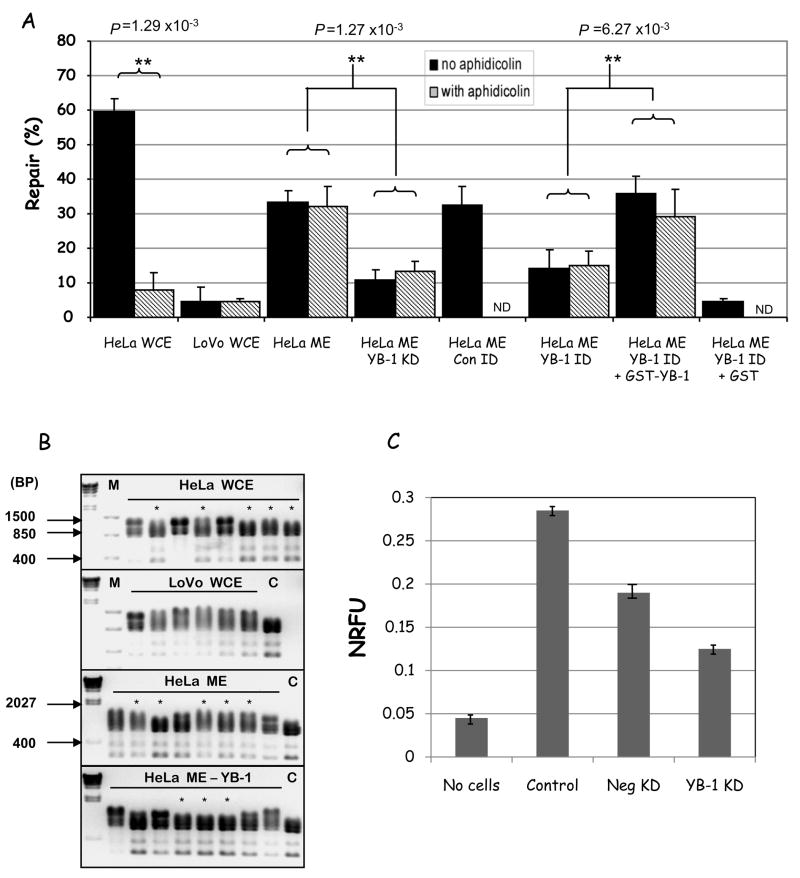
Maintenance of the mitochondrial genome (mtDNA) is essential for proper cellular function. The accumulation of damage and mutations in the mtDNA leads to diseases, cancer, and aging. Mammalian mitochondria have proficient base excision repair, but the existence of other DNA repair pathways is still unclear. Deficiencies in DNA mismatch repair (MMR), which corrects base mismatches and small loops, are associated with DNA microsatellite instability, accumulation of mutations, and cancer. MMR proteins have been identified in yeast and coral mitochondria; however, MMR proteins and function have not yet been detected in human mitochondria. Here we show that human mitochondria have a robust mismatch-repair activity, which is distinct from nuclear MMR. Key nuclear MMR factors were not detected in mitochondria, and similar mismatch-binding activity was observed in mitochondrial extracts from cells lacking MSH2, suggesting distinctive pathways for nuclear and mitochondrial MMR. We identified the repair factor YB-1 as a key candidate for a mitochondrial mismatch-binding protein. This protein localizes to mitochondria in human cells, and contributes significantly to the mismatch-binding and mismatch-repair activity detected in HeLa mitochondrial extracts, which are significantly decreased when the intracellular levels of YB-1 are diminished. Moreover, YB-1 depletion in cells increases mitochondrial DNA mutagenesis. Our results show that human mitochondria contain a functional MMR repair pathway in which YB-1 participates, likely in the mismatch-binding and recognition steps.


Figures

Figure 1
Figure 1
A. Western blot analysis of mitochondrial purity using Pol β, Lamin B, and GRB2 (nuclear and cytosolic markers, respectively) and COXIV (mitochondrial marker) antibodies. Amounts of protein loaded in the gels are listed bellow the blots; relative % purities (using ImageQuant quantification) are given in the text. B. MMR activity using M13 dG/dG mismatched substrate with a 3′ nick with HeLa WCE (HeLa positive), LoVo WCE (LoVo negative) and HeLa ME (HeLa mitoplasts). Results are shown as relative % repair compared to control (mock). N = 3; results are shown as ±SEM. C. MMR activity using M13 dG/dG mismatched substrate as before in the absence (black bars) or presence (striped bars) of ethidium bromide, with the same extracts as above. The results presented are average ± SEM of two independent experiments; relevant p-values (Student’s t-test analysis) are given in the text.
Figure 2
Figure 2
A. Cellular localization of MMR proteins, MSH3, MSH6 and MLH1 in thymidine-treated HeLa cells. Antibodies against each protein were visualized with AlexaFluor 488-conjugated secondary antibodies (green); mitochondria were labelled with Mitotracker Red (red) and the nuclei with DAPI (blue). DIC and merged images including cytoplasmic details (6–8x zoom) are also shown. Pearson’s correlation coefficients are ≤ 0.15 for all samples.
Figure 3
Figure 3
A. EMSA of mismatch-containing substrate with HeLa mitochondrial extracts. Substrates: dG/dG (L1, 2 & 6), dG/dA (L3), dG/T (L4 & 7), dG:dC (L5 & 8), 4 bp- and 1 bp-insertion (+4 & +1, L9 & 10). L1 shows substrate alone; L6, heat-inactivated lysate (‘▲’, 95°C, 5 min). Electrophoretic origin: ‘well’, shifted species, and free substrate are indicated. Binding data is given in the text; N=3, values are mean ±SEM. B. Competition assays using unspecific competitor DNA were carried out essentially as in (A), with labelled dG/dG substrate, without (N) or with the addition of 20 ng of each poly[dI-dC]•[dI-dC] (DS), poly[dI-dC] (SS). C. EMSA was performed using dG/dG substrate, as in (A), heated at 95°C for 10 min (lanes 2 and 4) or not (lanes 1 and 3), and analyzed as above. Mitochondrial extracts from GM1310 (lanes 1 and 2) or HeLa cells (lanes 3 and 4) were analyzed. D. EMSA on +1IDL substrate with HeLa whole cell extract (WCE, lane 2), mitochondrial extract (M, lane 3), or mitoplast extracts (MP, lane 4). Lane 1 is substrate alone. E. Top panel: Western blot with hMSH2 antibody of nuclear (NE) and mitochondrial extracts (ME) from HeLa, HEC59 (msh2-deficient) and HEC59/2–5 (HEC59 complemented with chromosomes 2 and 4); purified hMutSα protein (L7, as MSH2/MSH6) is included as a positive control for MHS2 as indicated. Sizes are marked. Bottom panel: EMSA with mitochondrial extracts from HeLa (lanes 1 & 2), HEC59 (lanes 3 & 4) and HEC59/2–4 (lanes 5 & 6) cells on dG/dG (lanes 1, 3 & 5) mismatched or control dG:dC (lanes 2, 4 & 6) substrates.
Figure 3
Figure 3
A. EMSA of mismatch-containing substrate with HeLa mitochondrial extracts. Substrates: dG/dG (L1, 2 & 6), dG/dA (L3), dG/T (L4 & 7), dG:dC (L5 & 8), 4 bp- and 1 bp-insertion (+4 & +1, L9 & 10). L1 shows substrate alone; L6, heat-inactivated lysate (‘▲’, 95°C, 5 min). Electrophoretic origin: ‘well’, shifted species, and free substrate are indicated. Binding data is given in the text; N=3, values are mean ±SEM. B. Competition assays using unspecific competitor DNA were carried out essentially as in (A), with labelled dG/dG substrate, without (N) or with the addition of 20 ng of each poly[dI-dC]•[dI-dC] (DS), poly[dI-dC] (SS). C. EMSA was performed using dG/dG substrate, as in (A), heated at 95°C for 10 min (lanes 2 and 4) or not (lanes 1 and 3), and analyzed as above. Mitochondrial extracts from GM1310 (lanes 1 and 2) or HeLa cells (lanes 3 and 4) were analyzed. D. EMSA on +1IDL substrate with HeLa whole cell extract (WCE, lane 2), mitochondrial extract (M, lane 3), or mitoplast extracts (MP, lane 4). Lane 1 is substrate alone. E. Top panel: Western blot with hMSH2 antibody of nuclear (NE) and mitochondrial extracts (ME) from HeLa, HEC59 (msh2-deficient) and HEC59/2–5 (HEC59 complemented with chromosomes 2 and 4); purified hMutSα protein (L7, as MSH2/MSH6) is included as a positive control for MHS2 as indicated. Sizes are marked. Bottom panel: EMSA with mitochondrial extracts from HeLa (lanes 1 & 2), HEC59 (lanes 3 & 4) and HEC59/2–4 (lanes 5 & 6) cells on dG/dG (lanes 1, 3 & 5) mismatched or control dG:dC (lanes 2, 4 & 6) substrates.
Figure 4
Figure 4
A. Purification scheme used to identify putative mitochondrial mismatch-binding proteins. B. Depiction of the affinity purification scheme using biotinylated-mismatch substrate and streptavidin-conjugated magnetic beads. C. Representative SDS-PAGE after affinity purification of concentrated lysate after fractionation on biotinylated +1 IDL substrate. Lane 2 = input (W), L3 = mismatch-bound (MME) and lane 4 = homoduplex-bound species (CE). Mismatch-specific species (lane 3) were taken for MS analysis (see arrows). Lane 1 shows the molecular weight markers (M)
Figure 5
Figure 5
A. Cellular localization of YB-1 thymidine-stressed HeLa cells. Anti-YB-1 antibody was visualized with AlexaFluor 488 secondary antibody (green). Mitochondria were labelled with MitoTracker Red (red). The merged image shows co-localization appearing as yellow. Pearson’s coefficient = 0.626 with stringent threshold. B. Thymidine- treated HeLa cells were transfected with GFP-YB-1 (Gaudreault et al., 2004) and incubated with MitoTracker Red for visualizing mitochondria. PH2 = phase contrast (transmitted light) image; MT = MitoTracker red, and YB-1 = transfected GFP-YB-1 signal. Co-localization appears yellow (see ‘Merge’). C. EMSA with recombinant purified GST-YB-1 (YB) (lanes 2, 5 and 8) or GST alone (G) (lanes 3, 6 and 9) on +1 IDL (7–9) and G:C (control) (4–6) substrates. A Y-box-containing substrate was also used as positive control (lanes 1–3) (Machwe et al., 2002).
Figure 6
Figure 6
A. Western analysis of HeLa WCE harvested 72 hrs after YB-1 siRNA knockdown. Even loading was ascertained by staining with DB-71. Lane 1 = mock-transfected, lane 2 = scrambled siRNA; lane 3 = positive control siRNA (Lamin A/C (KD = 70%, data not shown); lanes 4, 5, and 6 have siRNA targeted to exons 2, 3 & 5 of YB-1 respectively, and lane 7 shows knockdown using all three. Levels of YB-1 relative to control cells (lane 1) are given. B. Mitoplasts obtained from cells depleted of YB-1 (using the E235 siRNA pool) were tested for purity using Western blot as described in Fig. 1A. Whole cell extracts (WCE) and mitoplast extracts (ME) are shown for both negative control (lanes 1 & 2) and YB-1-siRNA treated (lanes 3 & 4) cells. Size markers are shown (kDa). C. Western analysis of HeLa mitochondrial extracts after immunodepletion with anti-YB-1 antibody (lane 2, ‘YB-1 ID’) or IgG-control (lane 1 ‘mock’). Amounts of protein loaded in the gel are shown below the blot. D. EMSA with mitochondrial extracts mock or YB-1 immunodepleted (lanes 2 & 3, respectively), or extracts from mitochondria obtained from cells transfected with negative or YB-1 siRNA (as above) (lanes 4 & 5, respectively) on the +1 IDL substrate. Quantification for the lower binding species shows around 80% reduction (binding values: ID-control = 4% ± 0.42, YB-1-ID = 0.72% ± 1.3; KD control is 7.2% = 0.21, YB-1-KD = 1.6% ± 0.83 (SEM), N=3 for ID & N=2 for KD). The differences between each +/− YB-1 lysate were analysed by Student’s t-test and were significant for both: ID, p =2.93×10⁻⁴, KD, p = 0.022.
Figure 7
Figure 7
A. MMR activity measured using the M13 dG/dG mismatched substrate, as described before, in absence (black bars) or presence (striped bars) of aphidicolin. Where indicated, YB-1 deficient lysates were from the immunodepletion (ID) or knockdown (KD) as above. Repair data and significances are given as before. Differences were analysed using Student’s t-test. ND = not determined. B. MMR activity measured using restriction digest analysis of dG/T mismatched substrates after in vitro incubation with the extracts. Repaired plasmids for each lysate are marked (*); repaired plasmids show 3 bands after Tfi1 digestion (865 bp, 793 bp, and 346 bp), while unrepaired show 4 bands after Tfi1 digestion (1139 bp, 865 bp, 793 bp, and 346 bp). Crude repair percentages were calculated as the fraction of repaired plasmids over the total screened, e.g. for HeLa WCE has 5/8 repair = 63%. Lane 1 in each gel is Lambda ladder after HindIII digest and M = Fermentas FastRuler low range molecular weight marker; sizes are marked (BP = base pairs). C = digested (non-mismatched) plasmid control. C. Cellular oxygen consumption for HeLa cells mock-transfected (control) or transfected with scrambled (Neg KD) or YB-1 (YB-1 KD) siRNAs was measured using the BD Oxygen Biosensor System. Normalized relative fluorescence units (NRFU) were obtained by normalizing the values to 0% O2 dissolved, after the addition of sodium borohydride. Lower NRFU indicate more O2 dissolved in the medium and therefore lower oxygen consumption; a control with no cells in the wells is shown as reference. The values presented are the average ± STD of two independent experiments.
Figure 8
Figure 8
A. HeLa cells were exposed to increasing concentrations of Antimycin A for 72 hrs; the cells were then replated at 500 cells/well and selected for CAP resistance in presence of 300 μg/ml of chloramphenicol. Resistant colonies were counted 7 days later. The results represent the average ± STD of two independent experiments, performed in triplicate. B. HeLa cells were either mock-transfected (1 and 2) or transfected with siRNAs against YB-1 (3–6), as described earlier. After 72 h the cells were replated at 500 cells/well and selected for CAP resistance, as above. After 7 days, the colonies were visualized and counted. This image is a representative of 3 independent experiments. Wells 1, 3 and 5 show cells mock-transfected or transfected with siRNA 1 and 2, respectively, grown in absence of CAP; wells 2, 4 and 6 show the same cells, respectively, grown in presence of 300 300 μg/ml CAP. C. Quantification of the results obtained with mock- and YB-1 siRNA-transfected HeLa cells, selected for CAP-resistance as described above. The results presented are the average ± STD of two independent experiments, performed in duplicate.

References

    1. Acharya S, Wilson T, Gradia S, Kane MF, Guerrette S, Marsischky GT, Kolodner R, Fishel R. hMSH2 forms specific mispair-binding complexes with hMSH3 and hMSH6. Proc Natl Acad Sci U S A. 1996;93:13629–13634. - PMC - PubMed
    1. Alazzouzi H, Farriol M, Espin E, Armengol M, Pena M, Zeh K, Schwartz S, Schwartz S., Jr Molecular patterns of nuclear and mitochondrial microsatellite alterations in breast tumors. Oncol Rep. 2003;10:1561–1567. - PubMed
    1. Anderson S, Bankier AT, Barrell BG, de Bruijn MH, Coulson AR, Drouin J, Eperon IC, Nierlich DP, Roe BA, Sanger F, Schreier PH, Smith AJ, Staden R, Young IG. Sequence and organization of the human mitochondrial genome. Nature. 1981;290:457–465. - PubMed
    1. Bannikova S, Zorov DB, Shoeman RL, Tolstonog GV, Traub P. Stability and association with the cytomatrix of mitochondrial DNA in spontaneously immortalized mouse embryo fibroblasts containing or lacking the intermediate filament protein vimentin. DNA Cell Biol. 2005;24:710–735. - PubMed
    1. Ben Yehuda A, Globerson A, Krichevsky S, Bar OH, Kidron M, Friedlander Y, Friedman G, Ben Yehuda D. Ageing and the mismatch repair system. Mech Ageing Dev. 2000;121:173–179. - PubMed

Publication types

LinkOut - more resources