Review
. 2009 Jan 1;14(4):1247-69.
doi: 10.2741/3306.

The evolution of vertebrate opioid receptors

Affiliations
Review

The evolution of vertebrate opioid receptors

Craig W Stevens. Front Biosci (Landmark Ed). .

Abstract

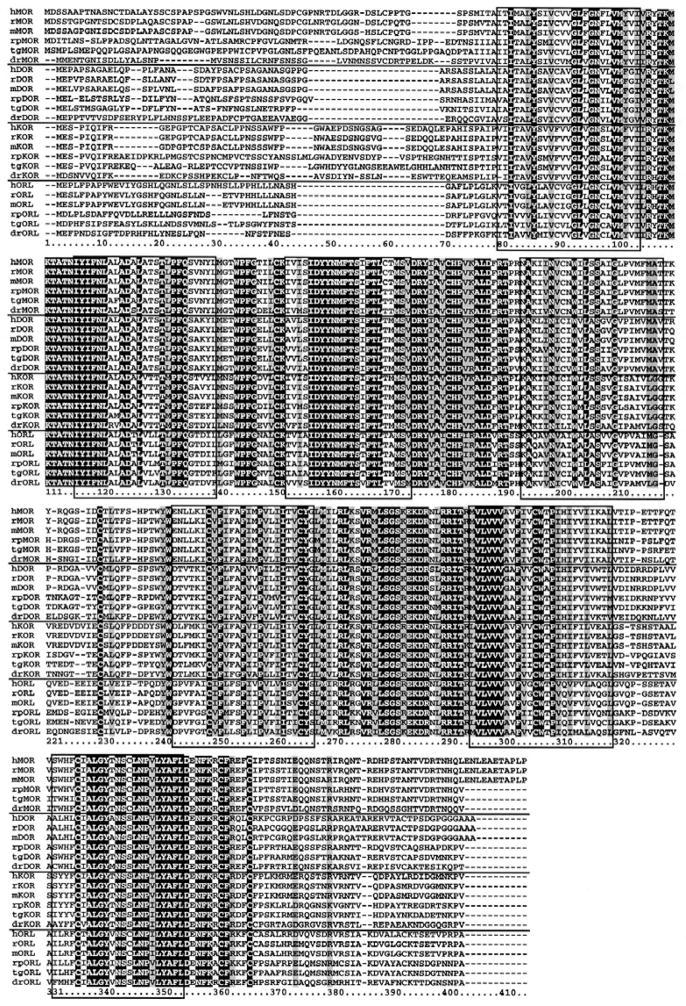
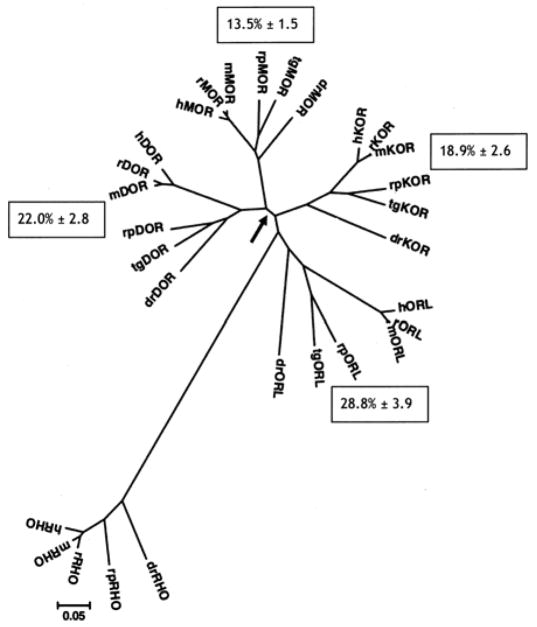
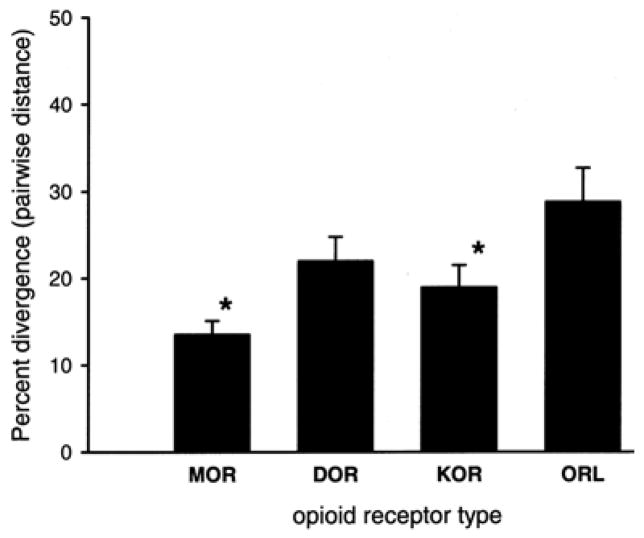
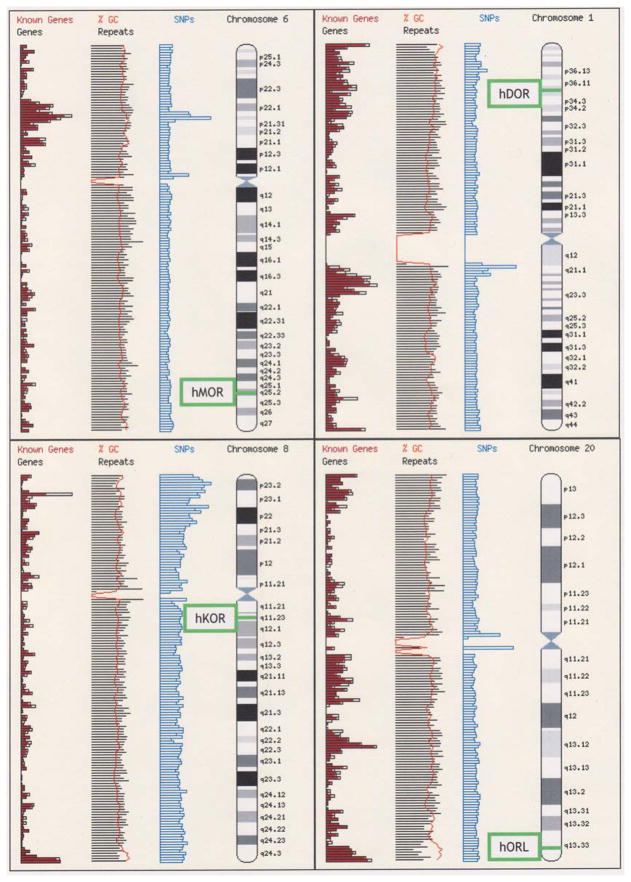
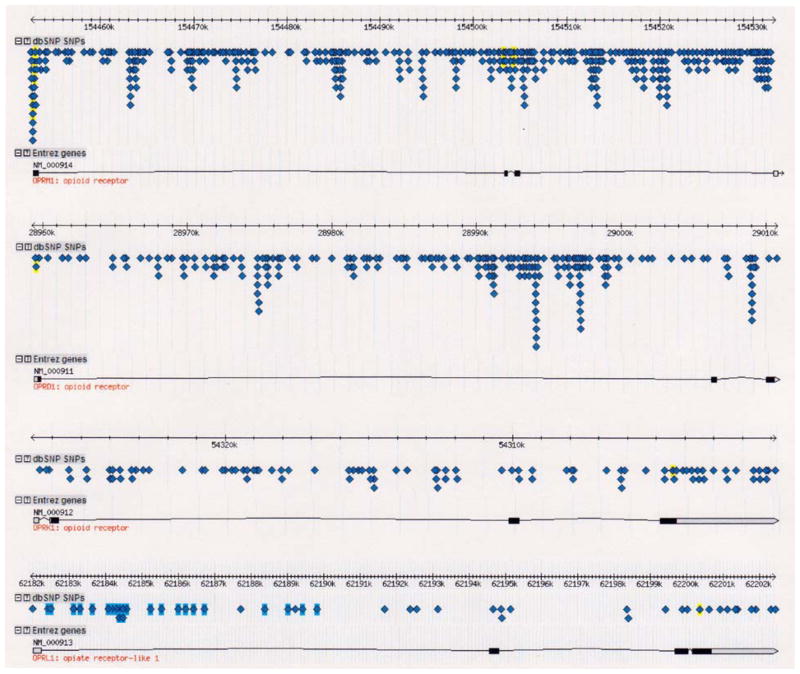
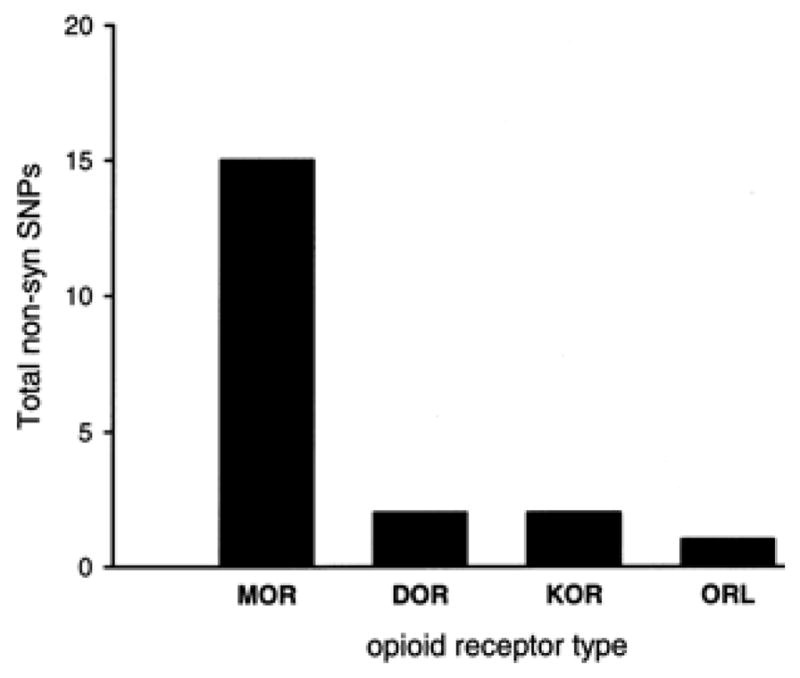
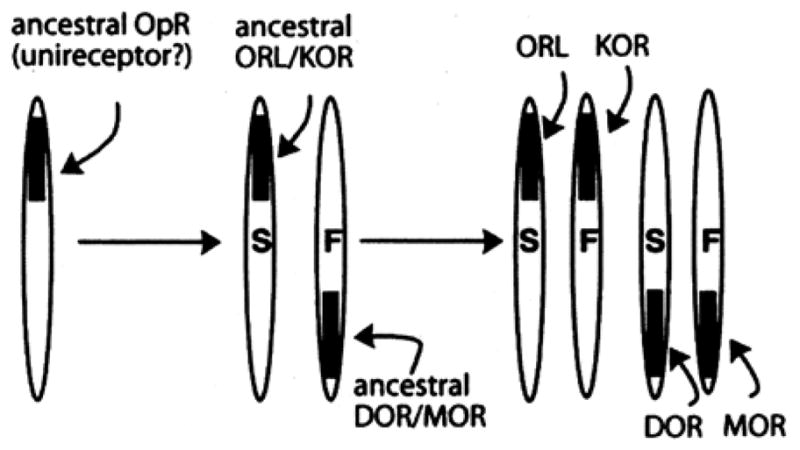
The proteins that mediate the analgesic and other effects of opioid drugs and endogenous opioid peptides are known as opioid receptors. Opioid receptors consist of a family of four closely-related proteins belonging to the large superfamily of G-protein coupled receptors. The three types of opioid receptors shown unequivocally to mediate analgesia in animal models are the mu (MOR), delta (DOR), and kappa (KOR) opioid receptor proteins. The role of the fourth member of the opioid receptor family, the nociceptin or orphanin FQ receptor (ORL), is not as clear as hyperalgesia, analgesia, and no effect was reported after administration of ORL agonists. There are now cDNA sequences for all four types of opioid receptors that are expressed in the brain of six species from three different classes of vertebrates. This review presents a comparative analysis of vertebrate opioid receptors using bioinformatics and data from recent human genome studies. Results indicate that opioid receptors arose by gene duplication, that there is a vector of opioid receptor divergence, and that MOR shows evidence of rapid evolution.


Figures

Figure 1
Figure 1
Alignment of protein sequences of available sets of four opioid receptor types in six vertebrates. Protein alignment was done using ClustalW with default values (MEGA v. 4.0. at http://www.megasoftware.net). Identical sites are indicated by white text on black background, conservative substitutions noted by gray background (using Boxshade at http://mobyle.pasteur.fr/cgi-bin/MobylePortal/portal.py?form=boxshade). Boxed-in domains indicate the seven transmembrane regions of the receptor proteins and numbers below the sequences are the alignment positions. Key: humans, Homo sapiens (h); mouse, Mus musculus (m); rat, Rattus norvegicus (r); leopard frog, Rana pipiens (rp); rough-skinned newt, Taricha granulosa (tg); and the zebrafish, Danio rerio (dr).
Figure 2
Figure 2
Phylogenetic analysis of MOR, DOR KOR and ORL sequences in six vertebrates. Bioinformatics software (MEGA v. 4.0.) was used to generate a radial phylogenetic tree using the neighbor-joining method, rooted with the available matching sequences of rhodopsin (RHO). Protein sequences were from species listed in Table 1, where access numbers may also be found. Key: humans, Homo sapiens (h); mouse, Mus musculus (m); rat, Rattus norvegicus (r); leopard frog, Rana pipiens (rp); rough-skinned newt, Taricha granulosa (tg); and the zebrafish, Danio rerio (dr). The arrow shows the bifurcation of MOR and DOR sequences from KOR and ORL. Values in boxes by each opioid receptor type are the mean ± SEM of the pairwise distance (% divergence) among members of each type. Branch length is equal to the proportional difference among the sequences (scale bar = 0.0.5 or 5% difference in amino acid sequence).
Figure 3
Figure 3
The mean sequence divergence of vertebrate opioid receptor types. Pairwise distance was calculated for each group of six amino acid sequences following alignment by ClustalW (Poisson correction, uniform rate, gaps deleted; MEGA v. 4.0.). Mean plus SEM are plotted for each group. Asterisks indicate that the MOR and the KOR group significantly less divergent than the ORL group (one-way ANOVA followed by a post-hoc Newman-Keuls test, p=0.0.04; SigmaStat v. 3.1.)
Figure 4
Figure 4
Chromosomal mapping of human opioid receptor genes. Image adapted from screen captures of the Ensembl Human MapView (http://www.ensembl.org/Homo_sapiens/index.html). Note that hMOR, hDOR, hKOR, and hORL map to chromosomes 6, 1, 8, and 20, respectively. Also shown in vertical columns are the density of known genes, the % GC content, and SNPs cataloged along the chromosomes. The genes are precisely located as follows: hMOR-Chr6.
Figure 5
Figure 5
Chart of single-nucleotide polymorphisms for each human opioid receptor gene. Adapted from screen captures from the over 3 million database of SNPs (dbSNP) available at the HapMap website (http://www.hapmap.org ). Each triangular symbol represents a single SNP; the opioid receptor genes are noted by their database acronyms (OPRM1, OPRD1, OPRK1, and OPRL1 for hMOR, hDOR, hKOR, and hORL, respectively). Exons are designated by boxed regions along the line representing the genes; grayed boxes represent untranslated regions of the gene (5′ to the left, 3′ on the right) found on exon regions.
Figure 6
Figure 6
Plot of total non-synonymous single nucleotide polymorphisms (non-synSNPs) by type of human opioid receptor gene. See Table 3 for additional SNP data for human opioid receptor genes. There are a total of 15 non-syn SNPs in the exonic regions of hMOR, with 1 or 2 for the other types of opioid receptor genes.
Figure 7
Figure 7
The molecular evolution of vertebrate opioid receptors. For simplicity, the genes are referred to by the same acronym as the opioid receptor proteins they encode. ‘S’ denotes slow and ‘F’ fast rate of adaptive evolution. See text for further details.

References

    1. Attwood TK. A compendium of specific motifs for diagnosing GPCR subtypes. Trends Pharmacol Sci. 2001;22:162–165. - PubMed
    1. Perez DM. The evolutionarily triumphant g-protein-coupled receptor. Mol Pharmacol. 2003;63:1202–1205. - PubMed
    1. Perez DM. From plants to man: the GPCR “tree of life”. Mol Pharmacol. 2005;67:1383–1384. - PubMed
    1. Bockaert J, Pin JP. Molecular tinkering of G protein-coupled receptors: an evolutionary success. The EMBO Journal. 1999;18:1723–1729. - PMC - PubMed
    1. Fredriksson R, Lagerstrom MC, Lundin LG, Schioth HB. The G-protein-coupled receptors in the human genome form five main families: Phylogenetic analysis, paralogon groups, and fingerprints. Mol Pharmacol. 2003;63:1256–1272. - PubMed

Publication types

Substances