. 2009 May;29(10):2716-29.
doi: 10.1128/MCB.01638-08. Epub 2009 Mar 9.

Cholesterol metabolism: the main pathway acting downstream of cytochrome P450 oxidoreductase in skeletal development of the limb

Affiliations

Cholesterol metabolism: the main pathway acting downstream of cytochrome P450 oxidoreductase in skeletal development of the limb

Katy Schmidt et al. Mol Cell Biol. 2009 May.

Abstract

Cytochrome P450 oxidoreductase (POR) is the obligate electron donor for all microsomal cytochrome P450 enzymes, which catalyze the metabolism of a wide spectrum of xenobiotic and endobiotic compounds. Point mutations in POR have been found recently in patients with Antley-Bixler-like syndrome, which includes limb skeletal defects. In order to study P450 function during limb and skeletal development, we deleted POR specifically in mouse limb bud mesenchyme. Forelimbs and hind limbs in conditional knockout (CKO) mice were short with thin skeletal elements and fused joints. POR deletion occurred earlier in forelimbs than in hind limbs, leading additionally to soft tissue syndactyly and loss of wrist elements and phalanges due to changes in growth, cell death, and skeletal segmentation. Transcriptional analysis of E12.5 mouse forelimb buds demonstrated the expression of P450s involved in retinoic acid, cholesterol, and arachidonic acid metabolism. Biochemical analysis of CKO limbs confirmed retinoic acid excess. In CKO limbs, expression of genes throughout the whole cholesterol biosynthetic pathway was upregulated, and cholesterol deficiency can explain most aspects of the phenotype. Thus, cellular POR-dependent cholesterol synthesis is essential during limb and skeletal development. Modulation of P450 activity could contribute to susceptibility of the embryo and developing organs to teratogenesis.


Figures

FIG. 1.
FIG. 1.
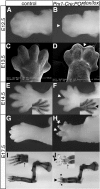
Timing of POR knockout in limb buds of Prx1-Cre; PORlox/lox mice. In situ hybridization with a POR-specific probe on limb buds at E10.5 (A to D) and E11.5 (E to H). No signal was detected in CKO forelimb buds at E10.5 (compare panels A and C). POR deletion in hind limb buds occurs later at E11.5 (compare panels F and H). (I) Detection of POR protein in whole-limb protein extracts. POR protein was markedly reduced in E10.5 forelimb buds of CKO mice and undetectable at E11.5 in forelimb buds but faintly present in hind limb buds. α-Tubulin was used as a loading control. Representative images of two independent Western blot analyses are shown.
FIG. 2.
FIG. 2.
Phenotypic characterization of 1-week-old Prx1-Cre; PORlox/lox forelimbs and hind limbs. (A) External view of CKO mouse and control littermate. Insets show dorsal view of forepaws; an arrowhead indicates splayed digits. Note the shorter forelimbs (arrowed) and overall size reduction. (B) Cartilage (Alcian Blue) and bone (Alizarin Red) staining of forelimbs and hind limbs. CKO forelimbs are shorter and have only two carpal bones (compare insets), no secondary ossification centers (open arrowhead), and a reduced number of phalanges in digits 1, 2, and 5 (stars). Processes on humerus and femur (arrows) are missing or reduced. CKO forepaws show characteristic splaying of digits 3 and 4 (arrowhead). Abbreviations: A, autopod; Fe, femur; Fi, fibula; Hu, humerus; Ra, radius; S, stylopod; Ti, tibia; Ul, ulna; Z, zeugopod.
FIG. 3.
FIG. 3.
Postnatal development of the phenotype. (A and B) μCT images of forepaws of 2-month-old mice. Dorsal view. Insets show histological sections through intraphalangeal joints. The CKO digit has malformed joints. (C and D) μMRI images of 2-month-old forepaws. A ventral view of the skeleton (darker purple) is shown; surface lipid deposits are rendered in yellow. The inset shows a histological section through a CKO paw confirming fat accumulation. Values given at the bottom are expressed as milligrams of extracted oil per gram of tissue (mean of seven mice each).
FIG. 4.
FIG. 4.
External and skeletal phenotype of Prx1-Cre; PORlox/lox forelimb buds during embryogenesis. Embryonic ages are indicated on the left, and genotypes are indicated across the top. (A, B, E, F, G, and H) External dorsal views of fixed limb buds. At E12.5, CKO forelimbs are slightly stunted (arrowhead). (C and D) Scanning electron microscopy of E13.5 limb buds. Note the extended space between digits 3 and 4 (arrowheads) at E13.5 and E14.5 and the webbing in E17.5 CKO forelimbs (H, star). (E and F, insets) Cartilage (in dark gray) staining of E14.5 forelimb buds. (I and J) Cartilage and bone (in black) staining of E17.5 forelimbs. Note the deeper indentation between digits 3 and 4 at E13.5, E14.5, and E17.5 (arrowheads). At E17.5, two carpal bones are present (compare I and J, insets, arrows); posterior and anterior digits are less well developed (J, stars). Two or three limb buds were examined for each genotype with little or no variation; for E17.5 at least five limb skeletons were stained, and representative examples for each genotype are shown.
FIG. 5.
FIG. 5.
Gene expression, proliferation, and apoptosis in Prx1-Cre; PORlox/lox forelimb buds. (A and B) In situ hybridization with a Msx2-specific probe at E12.5. Expression of Msx2 is reduced in CKO limb buds (B), with the exception of the interdigital space between digits 3 and 4 matching the observed phenotype. (C and D) TUNEL stain on 14-μm cryosections of E13.5 limb buds indicating interdigital cell death. Note the reduction between digits 1 and 3 in the CKO sample. (E and F) Phospho-H3 immunofluorescence at E13.5 showing overall reduced proliferative activity in distal region of CKO limb buds. The fluorescence images (C to F) are representative of two experiments. Note the interdigital space between digits 3 and 4 (white arrowhead). (G to L) In situ hybridization with GDF5-specific probe. Embryonic ages indicated on right, and genotypes are indicated across the top. Note the stunted appearance of the CKO limb buds at E13.5 coinciding with a reduction in GDF5 and more widespread expression of GDF5 at E14.5.
FIG. 6.
FIG. 6.
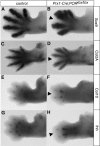
Chondrogenesis in Prx1-Cre; PORlox/lox forelimb buds at E13.5. Whole-mount in situ hybridizations for Sox9 (A and B), Col2A (C and D), Col10 (E and F), and Ihh (G and H). (A and B) Sox9 expression in CKO limb buds showed less sharp boundaries and no definitive joint-forming regions. (C and D) Col2A expressed in similar pattern to Sox9. Note the extended space between digits 3 and 4 in both expression patterns (arrowhead). (E and F) Expression of Col10 in hypertrophic chondrocytes increased at base of presumptive digits 3 and 4 but reduced in other three digits in CKO. (G and H) Ihh expression in prehypertrophic chondrocytes resembles Col10 pattern. The shapes and sizes—but not the locations—of both Col10 and Ihh expression domains were variable. No variation was observed for control embryos.
FIG. 7.
FIG. 7.
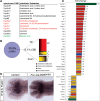
Microarray analysis of E12.5 forelimb buds. (A) Transcripts of P450 enzymes in control embryos. The table shows all annotated Cyps with present calls (detection call above background) in all five arrays, together with the substrate specificities (according to the KEGG database). (B) Differentially expressed genes. All statistically significant probe sets with low false discovery rates represent 39 differentially expressed genes (0.1% of all genes on array). Genes involved in cholesterol homeostasis (red), retinoic acid-metabolizing enzymes (green), transcription factors (blue), and unknown transcripts or genes of unclassified function (yellow). The largest group (22) of upregulated genes in CKO samples is involved in cholesterol biosynthesis. (C) Changes of each differentially expressed gene, given next to each bar. Color coding as in panel B. Upregulation of cholesterol biosynthesis pathway indicates cholesterol deficiency through metabolic feedback. (D) In situ hybridization for FoxC1. The expression pattern confirms microarray results.
FIG. 8.
FIG. 8.
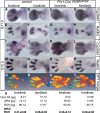
Retinoic acid homeostasis. (A to P) In situ hybridization for Cyp26B1 (A to D and I to L) and Raldh2 (E to H and M to P). Embryonic ages are indicated on the left, genotypes are indicated across the top, and riboprobes/methodology are indicated on the right. Hind limb buds were included as an internal control. Very little variation was seen. Note the accumulation of Cyp26B1 transcripts in CKO forelimb buds at E12.5 (compare panels I and K) and the reduction of Raldh2 transcripts (compare panels M and O); both findings are consistent with the microarray data (Fig. 7C). (Q to T) Optical projection tomography of E12.5 limb buds. Cyp26B1 (orange) and Raldh2 (green) expression patterns were digitally overlaid. Note that the interdigital space between digits 3 and 4 (white arrowhead) does not show overlapping expression of these two genes (S). (U) Quantification of atRA, retinol (ROH), and 13-cis retinoic acid (13cisRA) expressed as the mean per limb bud. Considerable variation was seen between samples for both genotypes, irrespective of whether the forelimb or hind limb was examined. Note that the mean value for atRA and the ratio of atRA/ROH (given as means ± the standard deviation) increased in CKO forelimbs but not hind limbs, a finding consistent with the expression patterns.
FIG. 9.
FIG. 9.
Changes in metabolism in Prx1-Cre; PORlox/lox limb bud cells and levels of cholesterol. (A) Cholesterol biosynthesis pathway (see also Table S2 in the supplemental material). Upregulated enzymes in CKO forelimb buds are shown (red). Note that Cyp51 as a POR-dependent enzyme is nonfunctional despite being upregulated. (B) POR deficiency on a cellular level based on microarray results. Colors: cholesterol metabolic pathway, red; cholesterol, red hexagons; cholesterol transport, yellow; retinoic acid metabolic pathway, green; transcription factors, blue. (C) Cholesterol quantification in E13.5 limb buds. CKO forelimbs show reduced cholesterol levels compared to controls Values were calculated per limb bud and represent the mean of three embryos. (D) Rescue experiment. To try and rescue the phenotype, dams were given a diet enriched with 2% cholesterol. Embryos were prepared at E14.5 and stained for cartilage. Splaying between digits 3 and 4 was reduced (compare to Fig. 4F).

Similar articles

Cited by

References

    1. Akiyama, H., M. C. Chaboissier, J. F. Martin, A. Schedl, and B. de Crombrugghe. 2002. The transcription factor Sox9 has essential roles in successive steps of the chondrocyte differentiation pathway and is required for expression of Sox5 and Sox6. Genes Dev. 162813-2828. - PMC - PubMed
    1. Bijlsma, M. F., K. S. Borensztajn, H. Roelink, M. P. Peppelenbosch, and C. A. Spek. 2007. Sonic hedgehog induces transcription-independent cytoskeletal rearrangement and migration regulated by arachidonate metabolites. Cell Signal. 192596-2604. - PubMed
    1. Black, S. D., and M. J. Coon. 1987. P-450 cytochromes: structure and function. Adv. Enzymol. Relat. Areas Mol. Biol. 6035-87. - PubMed
    1. Blomhoff, R., and H. K. Blomhoff. 2006. Overview of retinoid metabolism and function. J. Neurobiol. 66606-630. - PubMed
    1. Bogatcheva, N. V., M. G. Sergeeva, S. M. Dudek, and A. D. Verin. 2005. Arachidonic acid cascade in endothelial pathobiology. Microvasc. Res. 69107-127. - PubMed

Publication types

MeSH terms

Substances

LinkOut - more resources