. 2009 Jun;19(6):1044-56.
doi: 10.1101/gr.088773.108. Epub 2009 Mar 9.

Distinct DNA methylation patterns characterize differentiated human embryonic stem cells and developing human fetal liver

Affiliations

Distinct DNA methylation patterns characterize differentiated human embryonic stem cells and developing human fetal liver

Alayne L Brunner et al. Genome Res. 2009 Jun.

Abstract

To investigate the role of DNA methylation during human development, we developed Methyl-seq, a method that assays DNA methylation at more than 90,000 regions throughout the genome. Performing Methyl-seq on human embryonic stem cells (hESCs), their derivatives, and human tissues allowed us to identify several trends during hESC and in vivo liver differentiation. First, differentiation results in DNA methylation changes at a minimal number of assayed regions, both in vitro and in vivo (2%-11%). Second, in vitro hESC differentiation is characterized by both de novo methylation and demethylation, whereas in vivo fetal liver development is characterized predominantly by demethylation. Third, hESC differentiation is uniquely characterized by methylation changes specifically at H3K27me3-occupied regions, bivalent domains, and low density CpG promoters (LCPs), suggesting that these regions are more likely to be involved in transcriptional regulation during hESC differentiation. Although both H3K27me3-occupied domains and LCPs are also regions of high variability in DNA methylation state during human liver development, these regions become highly unmethylated, which is a distinct trend from that observed in hESCs. Taken together, our results indicate that hESC differentiation has a unique DNA methylation signature that may not be indicative of in vivo differentiation.


Figures

Figure 1.
Figure 1.
The Methyl-seq method and validation. (A) Workflow for the Methyl-seq assay. (B) Comparison of the number of Methyl-seq tags and Illumina beta values at 160 CpGs for four samples: HCT116, H9 hESC, H9 endoderm, and adult liver. HCT116 was used in Methyl-seq development and validation. There is good correlation between methylated calls (zero or one Methyl-seq tags and high beta values) and, likewise, unmethylated calls (low beta values and high numbers of sequencing tags) (for binary comparison, see Supplemental Fig. 7; P-values <10−8). (C) Receiver operator characteristic (ROC) curve generated from Methyl-seq and Illumina Infinium data. The area under the curve is 0.944.
Figure 2.
Figure 2.
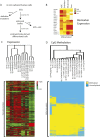
Expression and methylation changes in cells derived from hESCs and human tissues. (A) hESC in vitro differentiation scheme. (B) Expression of key genes in the liver differentiation pathway measured with expression arrays. Expression values are the average of intensities across all biological replicates and both parental hESC lines for each particular tissue. (C) Hierarchal clustering by genes and by samples of log-transformed, normalized expression data for key tissues in the endoderm-lineage model. Shown are a set of 2700 genes that clustered well. Sample numbers are shown in parentheses (see Supplemental Table 1). (D) Hierarchal clustering of the 90,612 Methyl-seq regions for each of the tissues assayed. HCT116 was used in Methyl-seq development and validation and shows reproducibility between biological replicates and concordance with MeDIPSeq data (for more information, see Supplemental Text; Supplemental Fig. 9). Library numbers are shown in parentheses (see Supplemental Table 2).
Figure 3.
Figure 3.
Browser shot of ∼9 kb of human chromosome 1 (hg18). Top data track shows sequence tags for the BG02 hESC HpaII library. Tags oriented in the forward direction are in blue; reverse direction, in red. The second grouping of data tracks illustrate the methylation calls for the Methyl-seq regions. Orange boxes represent methylated regions, and blue boxes are unmethylated regions. The third group of data tracks shows all of the predicted HpaII/MspI digestion sites (CCGG). The track labeled “MspI sites ≥4 tags” shows the Methyl-seq assayable sites, above the threshold of four. The last group of data tracks shows the regional annotations. LCPs are the low density CpG promoters, as predicted by Weber et al. (2007). The known genes and CpG islands were obtained from the UCSC Genome Browser. This window was chosen as an example of unmethylated and methylated regions, and shows regions with in vivo methylation changes: fetal liver 11 wk methylated vs. fetal liver 24 wk unmethylated (region 1); fetal liver methylated vs. adult liver unmethylated (region 2); a CPG island showing methylation differences between H9 samples and BG02 samples (region 3); and a region with differences between in vitro (methylated) and in vivo (unmethylated) samples (region 4).
Figure 4.
Figure 4.
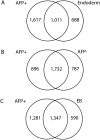
DNA methylation changes occurring between naïve H9 hESCs and various differentiated samples. (A) Venn diagram for methylation differences between H9 hESC (5) and H9 AFP+ hESC-derived cells (7) and differences between H9 hESC (5) and H9 Endoderm (6). (B) Venn diagram for methylation differences between H9 hESC (5) and H9 AFP+ hESC-derived cells (7) and differences between H9 hESC (5) and AFP-negative hESC-derived cells (8). (C) Venn diagram for methylation differences between H9 hESC (5) and H9 AFP+ hESC-derived cells (7) and differences between H9 hESC (5) and H9 embryoid bodies (EB) (9). Library numbers are in parentheses.
Figure 5.
Figure 5.
Hierarchal clustering of Methyl-seq regions for each of the tissues assayed. (A) Clustergram of Methyl-seq data reclustered by region for regions overlapping with annotated CpG islands (CGI) or regions outside of CpG islands (nonCGI). Samples are not reclustered from Figure 2D and are as follows. In vitro: H9 endoderm (6), H9 hESC (5), H9 conditioned medium (10), H9 AFP-positive hESC-derived cells (7), H9 AFP-negative hESC-derived cells (8), H9 embryoid bodies (9), BG02 hESC (12), BG02 EB-derived cells (13), BG02 EB-derived cells (14), H9 EB-derived cells (11); in vivo: fetal liver 11 wk (15), fetal liver 24 wk (16), adult liver (17). (B) Clustergram of Methyl-seq data reclustered by region overlap with gene structure annotations: promoters (Prom), 5′ UTRs (5′), coding exons (exon), introns (intron), 3′ UTRs (3′), and intergenic regions. Samples are again ordered as described in A. (C) Clustergram of Methyl-seq data reclustered by region overlap with promoter CpG density annotations: HCP, ICP, and LCP. Samples are ordered as described in A. (D) Clustergram of Methyl-seq data reclustered by region overlap with histone data: bivalent domains (bi), H3K4me3 (K4), H3K27me3 (K27), or regions bound by neither histone (neither). Samples are ordered as described in A.
Figure 6.
Figure 6.
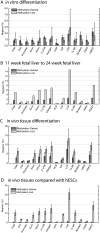
Percent of regions showing methylation changes by genomic feature. (A) Mean percentage of regions that gain or lose methylation in in vitro-differentiated cells compared with hESCs (y-axis), grouped by genomic features (x-axis). Categories are total changes, changes in CpG islands (CGI), promoters and 5′ UTRs (promoter), exons, introns, 3′ UTRs, intergenic regions (intergen), HCPs, ICPs, LCPs, 7× regulatory potential (7× RP), H3K4me3/H3K27me3-occupied regions (bivalent), H3K4me3-occupied regions (H3K4), and H3K27me3-occupied regions (H3K27). Error bars, maximum and minimum values across five differentiated sample comparisons: H9 hESC vs. H9 Endoderm (5→6), H9 hESC vs. H9 AFP+ hESC-derived cells (5→7), H9 hESC vs. H9 Embryoid bodies (5→9), H9 hESC vs. H9 EB-derived cells (5→11), BG02 hESC vs. BG02 EB-derived cells rep1 and rep2 (12→13,14). (B) Percentage of regions that gain or lose methylation in 11-wk fetal liver compared with 24-wk fetal liver (y-axis), grouped by genomic features (x-axis). Data are from the sample comparison between 11-wk fetal liver and 24-wk fetal liver (15→16). (C) Mean percentage of regions that gain or lose methylation during tissue differentiation (y-axis), grouped by genomic features (x-axis). Error bars, maximum and minimum values across three tissue sample comparisons: 11-wk fetal liver vs. 24-wk fetal liver (15→16), 11-wk fetal liver vs. adult liver (15→17), 24-wk fetal liver vs. adult liver (16→17). (D) Mean percentage of regions that gain or lose methylation in tissues compared with hESCs (y-axis), grouped by genomic features (x-axis). Error bars, maximum and minimum values across three tissue sample comparisons: H9 hESC and BG02 hESC vs. 11-wk fetal liver (5,12→15), H9 hESC and BG02 hESC vs. 24-wk fetal liver (5,12→16), H9 hESC and BG02 hESC vs. adult liver (5,12→17). Library numbers are in parentheses.

References

    1. Antequera F., Boyes J., Bird A. High levels of de novo methylation and altered chromatin structure at CpG islands in cell lines. Cell. 1990;62:503–514. - PubMed
    1. Bernstein B.E., Mikkelsen T.S., Xie X., Kamal M., Huebert D.J., Cuff J., Fry B., Meissner A., Wernig M., Plath K., et al. A bivalent chromatin structure marks key developmental genes in embryonic stem cells. Cell. 2006;125:315–326. - PubMed
    1. Bibikova M., Chudin E., Wu B., Zhou L., Garcia E.W., Liu Y., Shin S., Plaia T.W., Auerbach J.M., Arking D.E., et al. Human embryonic stem cells have a unique epigenetic signature. Genome Res. 2006;16:1075–1083. - PMC - PubMed
    1. Bird A. CpG islands as gene markers in the vertebrate nucleus. Trends Genet. 1987;3:342–347.
    1. Bird A. DNA methylation patterns and epigenetic memory. Genes & Dev. 2002;16:6–21. - PubMed

Publication types

MeSH terms