. 2009 Mar 16;206(3):577-93.
doi: 10.1084/jem.20081859. Epub 2009 Mar 9.

Critical role of phospholipase Cgamma2 in integrin and Fc receptor-mediated neutrophil functions and the effector phase of autoimmune arthritis

Affiliations

Critical role of phospholipase Cgamma2 in integrin and Fc receptor-mediated neutrophil functions and the effector phase of autoimmune arthritis

Zoltán Jakus et al. J Exp Med. .

Abstract

beta(2) integrins and Fcgamma receptors are critically involved in neutrophil activation at the site of inflammation. Both receptor types trigger a receptor-proximal tyrosine phosphorylation cascade through Src family kinases and Syk, but further downstream signaling events are poorly understood. We show that phospholipase C (PLC) gamma2 is phosphorylated downstream of Src family kinases and Syk during integrin or Fc receptor-mediated activation of neutrophils. PLCgamma2(-/-) neutrophils are completely defective in beta(2) integrin or Fcgamma receptor-mediated functional responses such as respiratory burst, degranulation, or cell spreading in vitro and show reduced adhesion/spreading in inflamed capillary venules in vivo. However, PLCgamma2(-/-) neutrophils respond normally to various other agonists, including chemokines, bacterial formyl peptides, Toll-like receptor ligands, or proinflammatory cytokines, and migrate normally both in vitro and in vivo. To confirm the in vivo relevance of these observations, the effect of the PLCgamma2(-/-) mutation was tested in the K/BxN serum transfer arthritis model, which is known to require beta(2) integrins, Fcgamma receptors, and neutrophils. PLCgamma2 deficiency completely protected mice from clinical signs and histological features of arthritis as well as from arthritis-induced loss of articular function. These results identify PLCgamma2 as a critical player of integrin and Fc receptor-mediated neutrophil functions and the neutrophil-mediated effector phase of autoimmune arthritis.


Figures
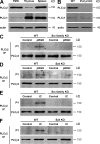
Figure 1.
Figure 1.
Expression and activation of PLCγ2 in neutrophils. (A) Expression of PLCγ2 and PLCγ1 in WT neutrophils compared with WT thymocytes and splenocytes. (B) Analysis of PLCγ1 and PLCγ2 expression in WT and PLCγ2−/− (PLCγ2 KO) neutrophils. (C and D) PLCγ2 phosphorylation in WT, Src family–deficient (Hck−/−Fgr−/−Lyn−/−; Src-family KO), or Syk−/− (Syk KO) neutrophils plated on a polyvalent integrin ligand (poly-RGD)-coated surface (pRGD) or left in suspension (control). PLCγ2 phosphorylation was tested by immunoprecipitation (IP) followed by immunoblotting with antibodies against phosphotyrosine (PY). (E and F) Phosphorylation of PLCγ2 in neutrophils of the various genotypes plated on an IgG immune complex–coated (IC) or control-treated surface. Immunoblotting for actin (A and B) and PLCγ2 (C–F) served as loading controls. Molecular mass values represent the estimated apparent molecular mass of the proteins. Each panel represents three to five independent experiments with similar results.
Figure 2.
Figure 2.
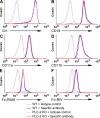
Expression of cell surface molecules on PLCγ2−/− neutrophils. Expression of the indicated cell surface molecules on unstimulated WT and PLCγ2−/− (PLCγ2 KO) bone marrow neutrophils was tested by flow cytometry. Each panel represents three to six independent experiments with similar results.
Figure 3.
Figure 3.
Defective integrin and Fc receptor-mediated responses of PLCγ2−/− neutrophils. (A–C) WT and PLCγ2−/− (PLCγ2 KO) neutrophils were activated by 50 ng/ml of murine TNF on a fibrinogen (Fbg)-coated surface and the resulting superoxide production (A), gelatinase release (B), and cell spreading (C) followed. (D) Superoxide release of fibrinogen-adherent neutrophils activated with 1 µg/ml Pam3CSK4, 5 µg/ml of ultrapurified LPS (upLPS), 10 ng/ml of murine GM-CSF, or 100 ng/ml of murine MIP-2. (E and F) Superoxide release (E) and spreading (F) of neutrophils plated on a polyvalent integrin ligand (poly-RGD)–coated surface (pRGD) in the absence of any additional stimulus. (G–I) Superoxide release (G), degranulation (H), and spreading (I) of neutrophils plated on immobilized IgG immune complexes (IC). Unstimulated control values were subtracted in A, D, and G. Error bars represent SD of triplicate readings. Bars, 50 µm. Each panel is representative of three to five independent experiments with similar results.
Figure 4.
Figure 4.
PLCγ2 is not required for integrin and Fc receptor-independent neutrophil functions. (A) Superoxide release of WT and PLCγ2−/− (PLCγ2 KO) neutrophils stimulated with 100 nM PMA. (B and C) Superoxide production (B) and gelatinase release (C) triggered by 3 µM fMLP from neutrophils preincubated with 10 µM cytochalasin B (CB). (D) Up-regulation of CD18 and CD11b upon activation of neutrophils by 50 ng/ml of murine TNF in suspension. (E and F) Phosphorylation of the p38 MAP kinase (p38) and of Iκ-Bα and degradation of Iκ-Bα upon activation of neutrophils with 50 ng/ml of murine TNF (E) or 1 µg/ml Pam3CSK4 (Pam3; F). (G and H) Phosphorylation of ERK and the p38 MAP kinase upon neutrophil activation by 10 ng/ml of murine GM-CSF (G) or 100 ng/ml of murine MIP-2 (H). Molecular mass values represent the estimated apparent molecular mass of the proteins. Unstimulated controls were subtracted in A and B. Error bars represent SD of triplicate readings. Each panel is representative of three to four independent experiments with similar results.
Figure 5.
Figure 5.
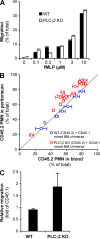
Normal in vitro and in vivo migration of PLCγ2−/− neutrophils. (A) Migration of WT and PLCγ2−/− (PLCγ2 KO) neutrophils toward the indicated concentrations of fMLP through fibrinogen-coated transwell membranes of 3-µm pore size. Error bars represent SD of duplicate readings. Data are representative of three independent experiments. (B and C) Competitive migration of CD45.2-expressing and CD45.1-expressing neutrophils during thioglycollate-induced sterile peritonitis in mixed bone marrow chimeras. (B) Percentage of CD45.2-expressing WT or PLCγ2−/− cells in the blood and the peritoneal lavage fluid. Each data point represents an individual mouse. The thin diagonal line marks points of identical percentage of CD45.2 cells in the blood and the peritoneum. Error bars represent SD from three blood samples taken at different time points from the same mouse. The data are combined from two independent experiments. (C) Relative migratory capacity of CD45.2-expressing WT or PLCγ2−/− neutrophils relative to the CD45.1-expressing cells calculated from the data presented in B. Error bars represent SD of values from 6 (WT) or 18 (PLCγ2−/−) individual mice.
Figure 6.
Figure 6.
Leukocyte–endothelial interaction in fMLP-treated cremaster muscle venules in vivo. (A and B) Intravital microscopy of postcapillary cremaster muscle venules superfused with 1 µM fMLP. (A) Leukocyte adhesion in postcapillary venules of WT and PLCγ2−/− (PLCγ2 KO) bone marrow chimeras before (pre) and at the indicated time points during superfusion with fMLP. (B) Leukocyte spreading in fMLP-superfused cremaster muscle venules. The rate of spreading is expressed as the percent decrease in cell diameter perpendicular to the vessel wall. Mean and SEM of data obtained from four WT and five PLCγ2 KO chimeras are shown. (C and D) Leukocyte adhesion (C) and extravasation (D) assessed by histological analysis of whole mount preparations of cremaster muscles of WT or PLCγ2 KO bone marrow chimeras superfused for 15 min in the presence or absence of 1 µM fMLP. The mean and SEM are shown of the number of intravascular (C) and perivascular (D) leukocytes in 29–41 individual vessels per group from four WT and five PLCγ2 KO chimeras, each tested independently during the same day.
Figure 7.
Figure 7.
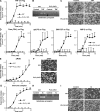
PLCγ2 is required for the development of K/B×N serum transfer arthritis. WT and PLCγ2−/− (PLCγ2 KO) bone marrow chimeras (A–C and G) or intact (nonchimeric) mice (D–F) were injected with 400 µl of arthritic (K/B×N) or nonarthritic control serum and the development of arthritis followed. (A) Photographs of the hind limb of mice of the indicated treatment and hematopoietic genotype 10 d after serum injection. Pictures are representative of a total of 17–23 individual mice per group from eight independent experiments. (B and C) Hind limb clinical score (B) and ankle thickness (C) of mice of the indicated treatment and genotype. Error bars represent the SD of four to eight individual clinical scores or ankle thickness values from a single experiment repeated a total of eight times. (D–F) Hind limb photographs (D), clinical score (E), and ankle thickness (F) of intact (nonchimeric) mice of the indicated treatment and genotype. Data are from three mice per group tested in parallel. Error bars represent the SD of six individual hind limb values from three mice per group. (G) Histological analysis of the ankle joint of mice of the indicated treatment and hematopoietic genotype 4 d after serum injection. The photomicrographs on the right are enlarged from the highlighted areas in the middle pictures. Original magnification, 5×. Bars: (left and middle) 200 µm; (right) 100 µm. Photomicrographs are representative of a total of four to six samples per group from three independent experiments.
Figure 8.
Figure 8.
PLCγ2 deficiency protects from arthritis-induced loss of articular function. WT and PLCγ2−/− (PLCγ2 KO) bone marrow chimeras (A and B) or intact (nonchimeric) mice (C) were injected with 400 µl of arthritic (K/B×N) or nonarthritic control serum. 6–12 d after the serum injection, the mice were placed on a custom-made wire grid, flipped over, and the time for which the mice were able to hold on to the lower side of the grid was recorded. (A) Snapshots at the indicated time points from video captures of mice of the indicated treatment and hematopoietic genotype 10 d after serum injection. The snapshots are representative of a total of 165–263 individual measurements on 10–16 mice per group from four independent experiments. (B) Quantitative analysis of the articular function as represented by the percentage of the bone marrow chimeras from a given group to hold on to the grid for a given period of time after the grid has been flipped over from four independent experiments. Error bars represent SEM of 10–16 individual “holding on curves” (obtained from 12–21 measurements on each single mouse between 8 and 12 d after serum transfer). (C) Quantitative analysis of the articular function of intact mice of the indicated treatment and genotype. Error bars represent SEM of three individual holding on curves (obtained from 18 measurements on each single mouse between 8 and 12 d after serum transfer).

Similar articles

Cited by

References

    1. Nathan C. 2006. Neutrophils and immunity: challenges and opportunities.Nat. Rev. Immunol. 6:173–182 - PubMed
    1. Weiss S.J. 1989. Tissue destruction by neutrophils.N. Engl. J. Med. 320:365–376 - PubMed
    1. Eyles J.L., Roberts A.W., Metcalf D., Wicks I.P. 2006. Granulocyte colony-stimulating factor and neutrophils - forgotten mediators of inflammatory disease.Nat. Clin. Pract. Rheumatol. 2:500–510 - PubMed
    1. Nathan C. 2002. Points of control in inflammation.Nature. 420:846–852 - PubMed
    1. Witko-Sarsat V., Rieu P., Descamps-Latscha B., Lesavre P., Halbwachs-Mecarelli L. 2000. Neutrophils: molecules, functions and pathophysiological aspects.Lab. Invest. 80:617–653 - PubMed

Publication types

MeSH terms