. 2009 Mar 31;106(13):5406-11.
doi: 10.1073/pnas.0813231106. Epub 2009 Mar 9.

Relative CO2/NH3 selectivities of AQP1, AQP4, AQP5, AmtB, and RhAG

Affiliations

Relative CO2/NH3 selectivities of AQP1, AQP4, AQP5, AmtB, and RhAG

Raif Musa-Aziz et al. Proc Natl Acad Sci U S A. .

Abstract

The water channel aquaporin 1 (AQP1) and certain Rh-family members are permeable to CO(2) and NH(3). Here, we use changes in surface pH (pH(S)) to assess relative CO(2) vs. NH(3) permeability of Xenopus oocytes expressing members of the AQP or Rh family. Exposed to CO(2) or NH(3), AQP1 oocytes exhibit a greater maximal magnitude of pH(S) change (DeltapH(S)) compared with day-matched controls injected with H(2)O or with RNA encoding SGLT1, NKCC2, or PepT1. With CO(2), AQP1 oocytes also have faster time constants for pH(S) relaxation (tau(pHs)). Thus, AQP1, but not the other proteins, conduct CO(2) and NH(3). Oocytes expressing rat AQP4, rat AQP5, human RhAG, or the bacterial Rh homolog AmtB also exhibit greater DeltapH(S)(CO(2)) and faster tau(pHs) compared with controls. Oocytes expressing AmtB and RhAG, but not AQP4 or AQP5, exhibit greater DeltapH(S)(NH(3)) values. Only AQPs exhibited significant osmotic water permeability (P(f)). We computed channel-dependent (*) DeltapH(S) or P(f) by subtracting values for H(2)O oocytes from those of channel-expressing oocytes. For the ratio DeltapH(S)(CO(2))*/P(f)*, the sequence was AQP5 > AQP1 congruent with AQP4. For DeltapH(S)(CO(2))*/DeltapH(S)(NH(3))*, the sequence was AQP4 congruent with AQP5 > AQP1 > AmtB > RhAG. Thus, each channel exhibits a characteristic ratio for indices of CO(2) vs. NH(3) permeability, demonstrating that, like ion channels, gas channels can exhibit selectivity.


Conflict of interest statement

The authors declare no conflict of interest.

Figures

Fig. 1.
Fig. 1.
Basis of surface pH changes. (A) CO2 influx. At the outer surface of the membrane, the CO2 influx creates a CO2 deficit. The reaction HCO3 + H+ → CO2 + H2O, in part, replenishes the CO2, raising pHS. (B) NH3 influx. The reaction NH4+ → NH3 + H+, in part, replenishes NH3, lowering pHS. (C–E) Representative pHS transients from oocytes injected with H2O or expressing AQP1 (record repeated in the 3 images), SGLT1, NKCC2, or PepT1. All data in C–E were obtained on the same day, from the same batch of oocytes, exposed first to CO2/HCO3 and then (after CO2 removal) to NH3/NH4+. Also shown in C are records with no oocyte present. Before and after solution changes, we retracted the pH electrode to the bulk extracellular solution (pH 7.50) for calibration. (F and G) Summary of extreme excursions of pHS (ΔpHS) for CO2 and NH3 data. (H and I) Representative pHS transients from day-matched H2O or AQP1 oocytes exposed to CO2/HCO3 or 30 mM butyrate. (J and K) Summary of ΔpHS for experiments like those in H or I. Values are means ± SE, with numbers of oocytes in parentheses. For F and G, statistical comparison between H2O-injected controls and other oocytes (separately for CO2 and NH3 data) were made using a 1-way ANOVA for 5 groups, followed by Dunnett's multiple comparison. ΔpHS values for H2O, NKCC2, and PepT1 do not differ from one other. For J and K, statistical comparisons were made using unpaired 2-tailed t tests.
Fig. 2.
Fig. 2.
Carbonic anhydrase activities of Xenopus oocytes. CA activity was determined from membrane preparations of 100 oocytes injected with H2O, 0.25 ng of cRNA encoding hCA IV, or 25 ng of cRNA encoding hAQP1. We divided each membrane preparation into aliquots containing 20 μg of total protein and performed a colorimetric CA assay on each aliquot (see SI Text). The sample mixtures containing CA-IV were run ± 100 μM methazolamide (MTZ), a CA inhibitor. Each N refers to a CA assay on 1 aliquot.
Fig. 3.
Fig. 3.
Surface pH changes caused by CO2 and NH3 influx in oocytes expressing gas-channel proteins. (A–E) Typical pHS transients from oocytes injected with H2O or expressing AQP1, AQP4, AQP5, WT AmtB or its inactive D160A mutant, or WT RhAG or its inactive D167A mutant. The protocol was the same as in Fig. 1. (F–J) Summary of extreme excursions of pHS (ΔpHS) caused by CO2 influx. Each image represents mean values for day-matched oocytes. (K–O) Summary of ΔpHS caused by NH3 influx. Each image (F–O) represents mean values for day-matched oocytes. Some H2O oocytes served as controls in more than 1 panel (total number of H2O oocytes: 54 for CO2, 61 for NH3). Values are means ± SE, with numbers of oocytes in parentheses. For F–H and K–M, statistical comparisons were made using unpaired 2-tailed t tests. For I and J and N and O, statistical comparisons were made using 1-way ANOVAs for 3 groups, followed by Student–Newman–Keuls analyses.
Fig. 4.
Fig. 4.
Western blots testing cleavage of the AmtB signal peptide in Xenopus oocytes. (A) Wild-type AmtB vs. uncleavable A22K mutant. (B) Wild-type AmtB vs. AmtB with truncated signal peptide. Data are representative of 4 similar experiments. All constructs were His tagged at the C terminus and detected with an anti-His antibody.
Fig. 5.
Fig. 5.
Osmotic water permeabilities of Xenopus oocytes. Pf (cm/s) of oocytes injected with H2O or cRNA encoding AQP1, AQP4, AQP5, AmtB, or RhAG. Values are means ± SE, with numbers of oocytes in parentheses. Statistical comparison between H2O vs. AQP oocytes were made using unpaired 2-tailed t tests. Statistical comparisons among the 4 groups were made using a 1-way ANOVA, followed by Student–Newman–Keuls analyses.
Fig. 6.
Fig. 6.
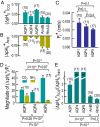
Comparison of channel-dependent properties. (A) Indices of channel-dependent CO2 permeability. For each ΔpHS from a channel-expressing oocyte, we subtracted the mean, day-matched ΔpHS for H2O oocytes. Bars represent mean subtracted values, the channel-dependent ΔpHS for CO2, or (ΔpHS*)CO2. Note: Oocytes in A are the same as those in B and C. (B) Indices of channel-dependent NH3 permeability. We computed (ΔpHS*)NH3 using the same approach as in A. (C) Channel-dependent water permeabilities. For each Pf from a channel-expressing oocyte, we subtracted the mean, day-matched Pf for H2O oocytes. Bars represent mean subtracted values, the channel-dependent Pf, or Pf*. (D) Indices of channel-dependent CO2 and NH3 permeability, normalized to Pf*. For each oocyte, we divided (ΔpHS*)CO2 and (ΔpHS*)NH3 by its Pf*. (E) Indices of gas selectivity. For each oocyte expressing AQP1, AmtB, or RhAG, we divided (ΔpHS*)CO2 by −(ΔpHS*)NH3. Because (ΔpHS*)NH3 was not significantly different from zero for oocytes expressing AQP4 or AQP5, we represent these ratios as “infinity.” Statistical comparisons were made using 1-way ANOVAs for 3 groups, followed by Student–Newman–Keuls analyses.

References

    1. Waisbren SJ, et al. Unusual permeability properties of gastric gland cells. Nature. 1994;368:332–335. - PubMed
    1. Nakhoul NL, et al. Effect of expressing the water channel aquaporin-1 on the CO2 permeability of Xenopus oocytes. Am J Physiol. 1998;274:C543–C548. - PubMed
    1. Cooper GJ, Boron WF. Effect of pCMBS on CO2 permeability of Xenopus oocytes expressing aquaporin 1 or its C189S mutant. Am J Physiol. 1998;275:C1481–C1486. - PubMed
    1. Prasad GV, et al. Reconstituted aquaporin 1 water channels transport CO2 across membranes. J Biol Chem. 1998;273:33123–33126. - PubMed
    1. Uehlein N, et al. The tobacco aquaporin NtAQP1 is a membrane CO2 pore with physiological functions. Nature. 2003;425:734–737. - PubMed

Publication types