

Use of stimulus-frequency otoacoustic emissions to investigate efferent and cochlear contributions to temporal overshoot
- PMID: 19275317
- PMCID: PMC2677284
- DOI: 10.1121/1.3068443
Use of stimulus-frequency otoacoustic emissions to investigate efferent and cochlear contributions to temporal overshoot
Abstract
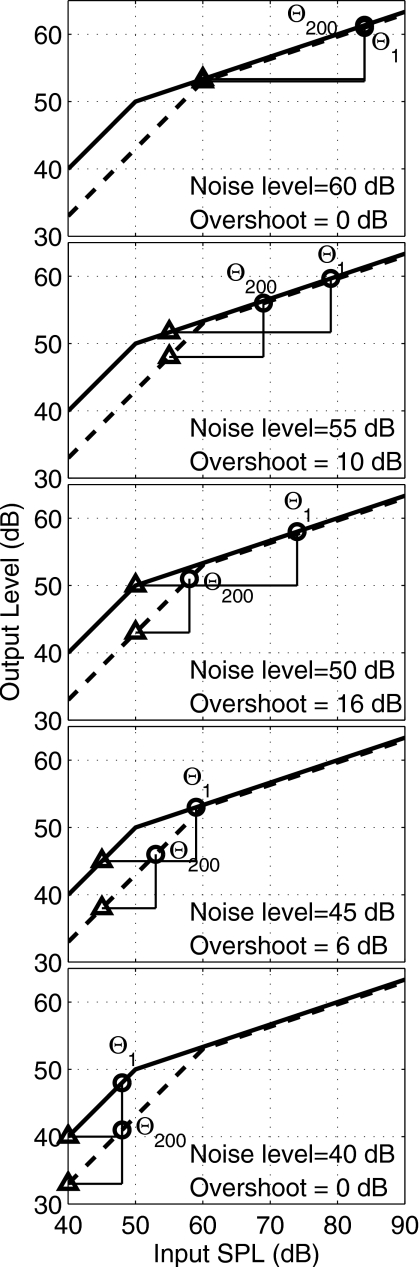
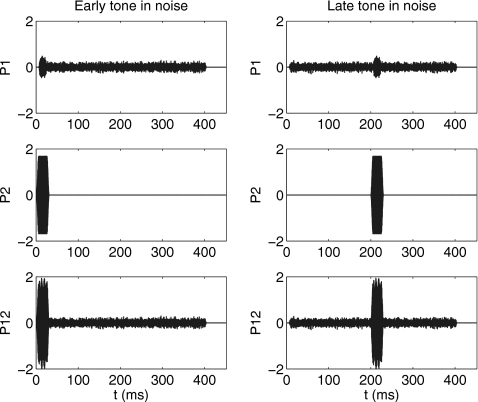
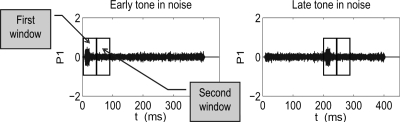
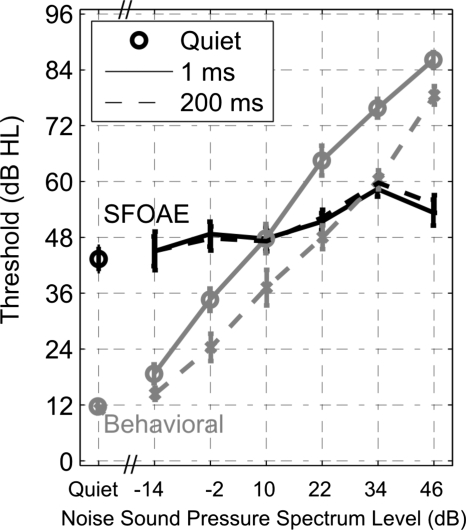
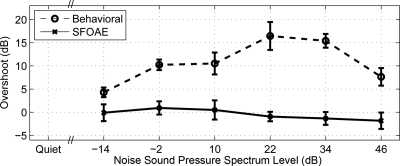
Behavioral threshold for a tone burst presented in a long-duration noise masker decreases as the onset of the tone burst is delayed relative to masker onset. The threshold difference between detection of early- and late-onset tone bursts is called overshoot. Although the underlying mechanisms are unclear, one hypothesis is that overshoot occurs due to efferent suppression of cochlear nonlinearity [von Klitzing, R., and Kohlrausch, A. (1994). J. Acoust. Soc. Am. 95, 2192-2201]. This hypothesis was tested by using overshoot conditions to elicit stimulus-frequency otoacoustic emissions (SFOAEs), which provide a physiological measure of cochlear nonlinearity. SFOAE and behavioral thresholds were estimated using a modified maximum-likelihood yes-no procedure. The masker was a 400-ms "frozen" notched noise. The signal was a 20-ms, 4-kHz tone burst presented at 1 or 200 ms after the noise onset. Behavioral overshoot results replicated previous studies, but no overshoot was observed in SFOAE thresholds. This suggests that either efferent suppression of cochlear nonlinearity is not involved in overshoot, or a SFOAE threshold estimation procedure based on stimuli similar to those used to study behavioral overshoot is not sensitive enough to measure the effect.
Figures
Similar articles
-
Overshoot measured physiologically and psychophysically in the same human ears.Hear Res. 2010 Sep 1;268(1-2):22-37. doi: 10.1016/j.heares.2010.04.007. Epub 2010 Apr 27. Hear Res. 2010. PMID: 20430072 Free PMC article.
-
Efferent-mediated reduction in cochlear gain does not alter tuning estimates from stimulus-frequency otoacoustic emission group delays.Neurosci Lett. 2014 Jan 24;559:132-5. doi: 10.1016/j.neulet.2013.11.059. Epub 2013 Dec 10. Neurosci Lett. 2014. PMID: 24333175
-
Suppression of stimulus frequency otoacoustic emissions by contralateral noise.Hear Res. 1995 Nov;91(1-2):167-77. doi: 10.1016/0378-5955(95)00187-5. Hear Res. 1995. PMID: 8647718 Clinical Trial.
-
Frequency specificity and left-ear advantage of medial olivocochlear efferent modulation: a study based on stimulus frequency otoacoustic emission.Neuroreport. 2017 Sep 6;28(13):775-778. doi: 10.1097/WNR.0000000000000812. Neuroreport. 2017. PMID: 28538522
-
Sources and mechanisms of DPOAE generation: implications for the prediction of auditory sensitivity.Ear Hear. 2003 Oct;24(5):367-79. doi: 10.1097/01.AUD.0000090439.16438.9F. Ear Hear. 2003. PMID: 14534408 Review.
Cited by
-
Cochlear efferent innervation and function.Curr Opin Otolaryngol Head Neck Surg. 2010 Oct;18(5):447-53. doi: 10.1097/MOO.0b013e32833e05d6. Curr Opin Otolaryngol Head Neck Surg. 2010. PMID: 20717032 Free PMC article. Review.
-
The time course of cochlear gain reduction measured using a more efficient psychophysical technique.J Acoust Soc Am. 2010 Sep;128(3):1203-14. doi: 10.1121/1.3473695. J Acoust Soc Am. 2010. PMID: 20815456 Free PMC article.
-
Properties of a nonlinear version of the stimulus-frequency otoacoustic emission.J Acoust Soc Am. 2010 Feb;127(2):955-69. doi: 10.1121/1.3279832. J Acoust Soc Am. 2010. PMID: 20136218 Free PMC article.
-
Temporal Effects on Monaural Amplitude-Modulation Sensitivity in Ipsilateral, Contralateral and Bilateral Noise.J Assoc Res Otolaryngol. 2018 Apr;19(2):147-161. doi: 10.1007/s10162-018-0656-x. Epub 2018 Mar 5. J Assoc Res Otolaryngol. 2018. PMID: 29508100 Free PMC article.
-
Effects of age and hearing loss on overshoot.J Acoust Soc Am. 2016 Oct;140(4):2481. doi: 10.1121/1.4964267. J Acoust Soc Am. 2016. PMID: 27794300 Free PMC article.
References
-
- Bacon, S. P., and Smith, M. A. (1991). “Spectral, intensive and temporal factors influencing overshoot,” Q. J. Exp. Psychol. 43A, 373–399. - PubMed
Publication types
MeSH terms
Grants and funding
LinkOut - more resources
Full Text Sources