

Low-frequency speech cues and simulated electric-acoustic hearing
- PMID: 19275323
- PMCID: PMC2736727
- DOI: 10.1121/1.3068441
Low-frequency speech cues and simulated electric-acoustic hearing
Abstract
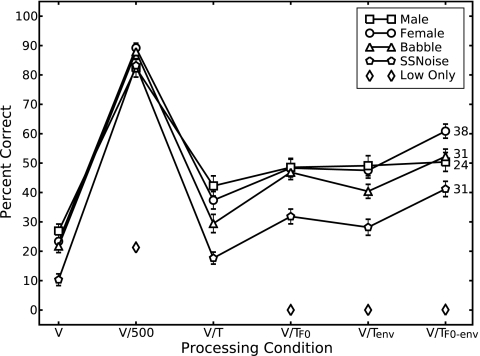
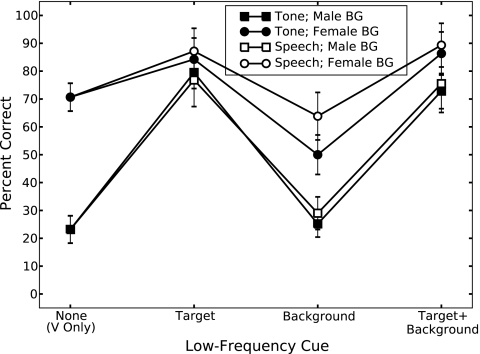
The addition of low-frequency acoustic information to real or simulated electric stimulation (so-called electric-acoustic stimulation or EAS) often results in large improvements in intelligibility, particularly in competing backgrounds. This may reflect the availability of fundamental frequency (F0) information in the acoustic region. The contributions of F0 and the amplitude envelope (as well as voicing) of speech to simulated EAS was examined by replacing the low-frequency speech with a tone that was modulated in frequency to track the F0 of the speech, in amplitude with the envelope of the low-frequency speech, or both. A four-channel vocoder simulated electric hearing. Significant benefit over vocoder alone was observed with the addition of a tone carrying F0 or envelope cues, and both cues combined typically provided significantly more benefit than either alone. The intelligibility improvement over vocoder was between 24 and 57 percentage points, and was unaffected by the presence of a tone carrying these cues from a background talker. These results confirm the importance of the F0 of target speech for EAS (in simulation). They indicate that significant benefit can be provided by a tone carrying F0 and amplitude envelope cues. The results support a glimpsing account of EAS and argue against segregation.
Figures
References
-
- ANSI (1996). “ANSI S3.6-1996, Specifications for audiometers,” (American National Standards Institute, New York).
-
- Assmann, P. F. (1999). “Fundamental frequency and the intelligibility of competing voices,” Proceedings of the 14th International Congress of Phonetic ScienceSan Francisco, August.
-
- Auditec (1997). “Auditory Tests (Revised),” Compact Disc, Auditec, St. Louis.
-
- Bell, T. S., Dirks, D. D., and Trine, T. D. (1992). “Frequency-importance functions for words in high- and low-context sentences,” J. Speech Hear. Res. JSPHAH 35, 950–959. - PubMed
Publication types
MeSH terms
Grants and funding
LinkOut - more resources
Full Text Sources
Other Literature Sources
Medical