. 2009 May 8;284(19):13244-55.
doi: 10.1074/jbc.M809250200. Epub 2009 Mar 10.

Structural basis for the antiproliferative activity of the Tob-hCaf1 complex

Affiliations

Structural basis for the antiproliferative activity of the Tob-hCaf1 complex

Masataka Horiuchi et al. J Biol Chem. .

Abstract

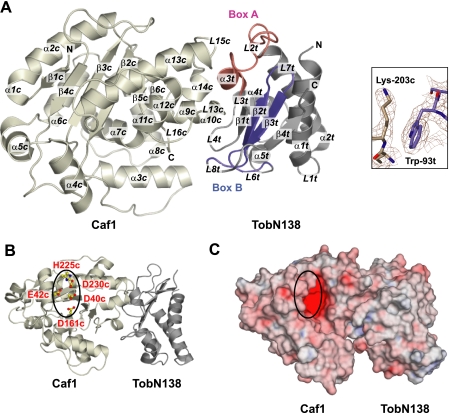
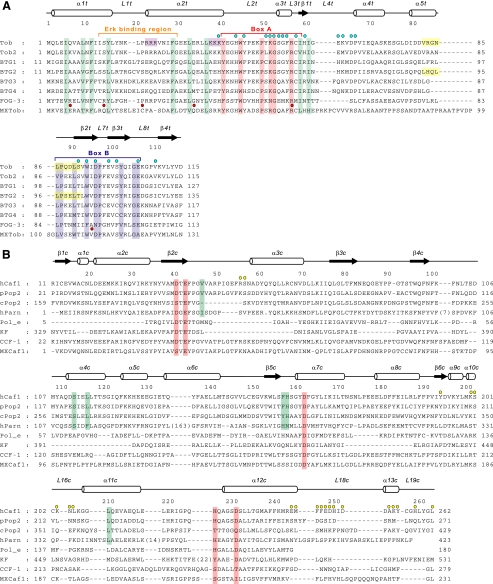
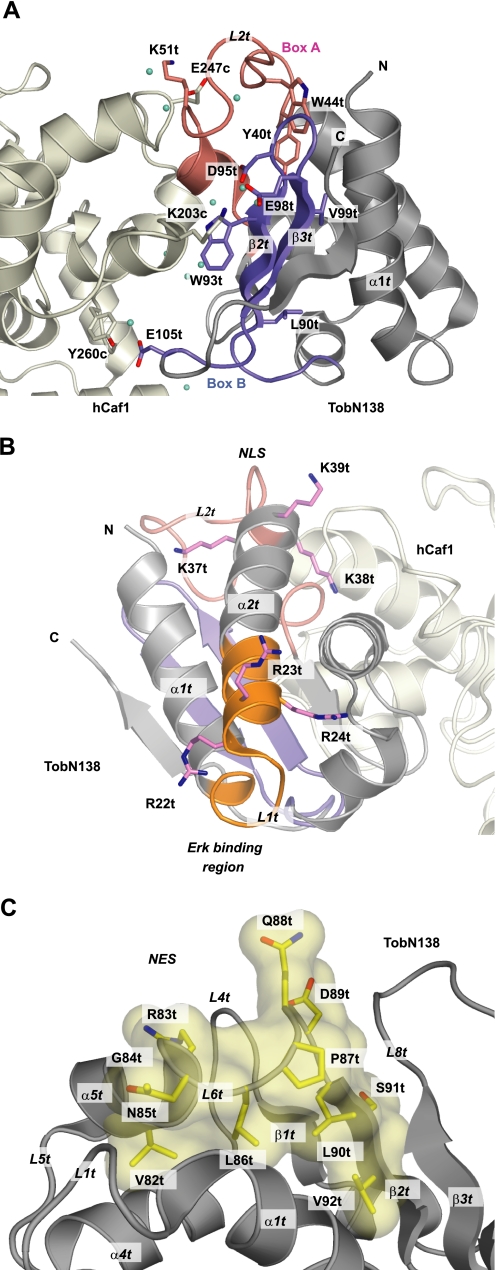
The Tob/BTG family is a group of antiproliferative proteins containing two highly homologous regions, Box A and Box B. These proteins all associate with CCR4-associated factor 1 (Caf1), which belongs to the ribonuclease D (RNase D) family of deadenylases and is a component of the CCR4-Not deadenylase complex. Here we determined the crystal structure of the complex of the N-terminal region of Tob and human Caf1 (hCaf1). Tob exhibited a novel fold, whereas hCaf1 most closely resembled the catalytic domain of yeast Pop2 and human poly(A)-specific ribonuclease. Interestingly, the association of hCaf1 was mediated by both Box A and Box B of Tob. Cell growth assays using both wild-type and mutant proteins revealed that deadenylase activity of Caf1 is not critical but complex formation is crucial to cell growth inhibition. Caf1 tethers Tob to the CCR4-Not deadenylase complex, and thereby Tob gathers several factors at its C-terminal region, such as poly(A)-binding proteins, to exert antiproliferative activity.


Figures

FIGURE 1.
FIGURE 1.
Structure of the TobN138-hCaf1 complex. A, ribbon diagram of the TobN138-hCaf1 complex labeled with secondary structures. hCaf1 is shown in light yellow and TobN138 in gray. Box A and Box B of Tob are shown in red and blue, respectively. The Fo - Fc omit map of the interacting residues of Trp-93t and Lys-203t at 1.0 σ contour level is displayed in the right panel. B, the side chains of the active site residues, enclosed by a circle, are shown as ball-and-stick models. C, the electrostatic surface potential of the hCaf1-TobN138 complex calculated by GROMACS. The view shown is from the same orientation as in B. Figs. 1, 4, and 5 were prepared with PyMOL.
FIGURE 2.
FIGURE 2.
Sequence alignments of Tob and hCaf1 with related proteins. A, sequence alignment of human Tob, Tob2, BTG1, BTG2, BTG3, FOG-3, and Tob-like protein of M. brevicollis MX1 (MXTob). The conserved residues in the Box A and Box B regions of BTG family proteins are shown in red and blue, respectively. The blue dots on the sequence denote the buried residues involved in the interaction surface with hCaf1. The red dots below the sequence denote the missense mutation sites in FOG-3. The conserved residues required for the maintenance of the hydrophobic core of the BTG domain are colored green. The basic residues for nuclear localization are shown in purple. The residues for nuclear export are shown in yellow. The region required for ERK binding is indicated by an orange line. The secondary structure of TobN138 is shown above of the sequences. B, sequence alignment of human Caf1 (hCaf1), S. pombe Pop2 (pPop2), S. cerevisiae Pop2 (yPop2), human poly(A)-specific ribonuclease PARN (hParn), the N-terminal exonuclease domain of the ε subunit of E. coli DNA polymerase III (Pol_e), E. coli exonuclease domain of Klenow flagment (KF), C. elegans CCF-1 (CCF1), and Caf1-like protein of M. brevicollis MX1 (MXCaf1). The presumed active site residues are colored in red. RNA binding residues in the crystal structure of the hPARN-RNA complex are colored in green. The yellow dots on the sequences denote the buried residues in the interaction surface with Tob. The secondary structure of hCaf1 is indicated above the sequences.
FIGURE 3.
FIGURE 3.
Nuclease activity of hCaf1. A, metal ion-dependent nuclease activity of hCaf1. Left panel, hCaf1 was incubated with MgCl2, CaCl2, MnCl2, or CoCl2 at 37 °C for 4 h in the presence of 5′-FITC-labeled DNA-A6. Right panel, hCaf1 was incubated with MgCl2, CaCl2, MnCl2, or CoCl2 at 37 °C for 30 min in the presence of 5′-FITC-labeled RNA-A6. B, base-specific nuclease activity of hCaf1. hCaf1 was incubated with MnCl2 in the presence of 5′-FITC-labeled RNA-A6, -C6, or -U6 at 37 °C for 0.5, 1, 1.5, 2, 3, 4, 5, or 10 min. As a negative control, a 30-min reaction was carried out in the absence of hCaf1 for each oligonucleotide. C, time course of degradation of FITC-labeled RNA by hCaf1. The graph shows the time courses of the degradation of the full-length RNA-A6 (open circles), RNA-C6 (open triangles), and RNA-U6 (filled triangles). The molar ratio of remaining full-length RNA to initial RNA concentration is plotted versus the reaction time. The amount of 5′-FITC-labeled full-length RNA was estimated using the software accompanying the FUJI FLA-2000 fluorescent imager. D, nuclease activity in the presence of TobN138 of hCaf1. 5′FITC-labeled RNA-A7 in the presence of 0, 0.25, 0.5, 1, and 2 μm TobN138 was incubated with 0.5 μm hCaf1 (left panel) and without hCaf1 (right panel) at 37 °C for 2 min.
FIGURE 4.
FIGURE 4.
Active site structure and identification of the catalytic residues of hCaf1. A, comparison of the active sites between hCaf1 with Mn2+ and hPARN with RNA. The conserved residues critical for nuclease activities are shown. Conserved residues in the catalytic sites of RNase D family proteins are displayed by ball-and-stick models colored in green and gray for hCaf1 and hPARN, respectively. The complex of single-stranded RNA is shown by a ball-and-stick model in yellow. The electron density map of Mn2+ bound to hCaf1 at 6σ is shown as a pink mesh. B, mutational analysis of the catalytic residues of hCaf1. The presumed active site residues, Asp-40c, Glu-42c, Asp-161c, His-225c, and Asp-230c, were replaced by Asn (D40N), Gln (E42Q), Asn (D161N), Ala (H225A), and Asn (D230N), respectively. Deadenylation by wild type (Wild) and each mutant of hCaf1 was examined after 30 min as described in the legend for Fig. 3B.
FIGURE 5.
FIGURE 5.
Biologically significant motifs in Tob. A, interaction sites of TobN138 with hCaf1. The residues that mediate the association of TobN138 with hCaf1 are shown as a stick model on the ribbon diagram. Water molecules are indicated by green dots. Box A and Box B regions of TobN138 are colored red and blue, respectively. B, Erk binding sites on Tob. The Arg residues binding to Erk are indicated as a stick model and colored purple. The Lys residues identified as the nuclear localization signal are also indicated as a stick model and colored purple. C, putative nuclear export signal (NES82-92) on Tob. The putative nuclear export signal, LX(1-3)LX(2-3)LXL, is indicated in yellow. The side chains of NES82-92 are shown as a stick model.
FIGURE 6.
FIGURE 6.
Mutational analysis of the binding site between Tob and hCaf1. A, gel-filtration profiles of the bacterial expressed GST-hCaf1-wild (left panel, bottom) and GST-hCaf1-k203A (right panel, bottom) in the presence of HisTobN138 and the Coomassie Blue staining pattern of the corresponding elution fractions (top of each panel). B, schematic representation of the Tob and hCaf1 used for affinity precipitation assays. Tob and TobN138 were fused to FLAG-tag. hCaf1, hCaf1-D40N, and hCaf1-K203A were fused to Strep-tag II. C, affinity precipitation assays of FLAG-tagged Tob with Strep-tag II-tagged hCaf1. Tob and hCaf1 were coexpressed in 293FT cells. Cell lysates were subjected to affinity precipitation with Strep-Tactin-Sepharose (AP: Strep), and FLAG-tagged or Strep-tag II-tagged proteins were detected by immunoblotting with the anti-FLAG M2 (IB: Flag) or anti-Strep-tag II antibody (IB: Strep). 2% of cell lysates were used as the Tob and TobN138 input (Input).
FIGURE 7.
FIGURE 7.
Cell growth experiment using the wild-type and mutants of Tob and hCaf1. NIH3T3 cells infected with the recombinant retrovirus pME-puro containing FLAG-tagged Tob and/or FLAG-tagged hCaf1. A, effect of continuous expression of FLAG-tagged Tob and/or FLAG-tagged hCaf1 on cell growth. Drug-selected cells were seeded at 1 × 10³ cells in 60-mm dishes. Ten days after seeding, colonies were stained by the Giemsa staining method. B, expression levels of Tob and hCaf1 in the infected cells. The expression of proteins was determined by immunoblotting (IB) using an antibody against FLAG-tag. Cell growth assay using HEK-293 (C and D) and COS-1 (E and F) cells. HEK-293 and COS-1 cells were seeded at 2 × 10⁴ cells/well, and only gene-expressing cells were selected 18 h after electroporation. C and E, cell growth curves for Tob, hCaf1, and hCaf1-D40N and the coexpression of Tob with hCaf1. D and F, cell growth curves for the coexpression of TobN138 with hCaf1, coexpression of Tob with hCaf1-K203A, and coexpression of Tob with hCaf1-D40N. The cell growth curve for the transfection of the vector alone was displayed as a control. Data points represent the mean ± S.E. of triplicate determinations, and the results are representative of 10 experiments (n = 30).

Similar articles

Cited by

References

    1. Tirone, F. (2001) J. Cell. Physiol. 187 155-165 - PubMed
    1. Matsuda, S., Rouault, J., Magaud, J., and Berthet, C. (2001) FEBS Lett. 497 67-72 - PubMed
    1. Matsuda, S., Kawamura-Tsuzuku, J., Ohsugi, M., Yoshida, M., Emi, M., Nakamura, Y., Onda, M., Yoshida, Y., Nishiyama, A., and Yamamoto, T. (1996) Oncogene 12 705-713 - PubMed
    1. Ikematsu, N., Yoshida, Y., Kawamura-Tsuzuku, J., Ohsugi, M., Onda, M., Hirai, M., Fujimoto, J., and Yamamoto, T. (1999) Oncogene 18 7432-7441 - PubMed
    1. Rouault, J. P., Rimokh, R., Tessa, C., Paranhos, G., Ffrench, M., Duret, L., Garoccio, M., Germain, D., Samarut, J., and Magaud, J. P. (1992) EMBO J. 11 1663-1670 - PMC - PubMed

Publication types

MeSH terms

Substances