. 2009 May 15;284(20):13551-13561.
doi: 10.1074/jbc.M807352200. Epub 2009 Mar 9.

Matrix metalloproteinase-2-deficient fibroblasts exhibit an alteration in the fibrotic response to connective tissue growth factor/CCN2 because of an increase in the levels of endogenous fibronectin

Affiliations

Matrix metalloproteinase-2-deficient fibroblasts exhibit an alteration in the fibrotic response to connective tissue growth factor/CCN2 because of an increase in the levels of endogenous fibronectin

Cristian A Droppelmann et al. J Biol Chem. .

Abstract

Matrix metalloproteinase-2 (MMP-2) is an important extracellular matrix remodeling enzyme, and it has been involved in different fibrotic disorders. The connective tissue growth factor (CTGF/CCN2), which is increased in these pathologies, induces the production of extracellular matrix proteins. To understand the fibrotic process observed in diverse pathologies, we analyzed the fibroblast response to CTGF when MMP-2 activity is inhibited. CTGF increased fibronectin (FN) amount, MMP-2 mRNA expression, and gelatinase activity in 3T3 cells. When MMP-2 activity was inhibited either by the metalloproteinase inhibitor GM-6001 or in MMP-2-deficient fibroblasts, an increase in the basal amount of FN together with a decrease of its levels in response to CTGF was observed. This paradoxical effect could be explained by the fact that the excess of FN could block the access to other ligands, such as CTGF, to integrins. This effect was emulated in fibroblasts by adding exogenous FN or RGDS peptides or using anti-integrin alpha(V) subunit-blocking antibodies. Additionally, in MMP-2-deficient cells CTGF did not induce the formation of stress fibers, focal adhesion sites, and ERK phosphorylation. Anti-integrin alpha(V) subunit-blocking antibodies inhibited ERK phosphorylation in control cells. Finally, in MMP-2-deficient cells, FN mRNA expression was not affected by CTGF, but degradation of (125)I-FN was increased. These results suggest that expression, regulation, and activity of MMP-2 can play an important role in the initial steps of fibrosis and shows that FN levels can regulate the cellular response to CTGF.


Figures
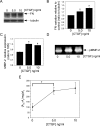
FIGURE 1.
FIGURE 1.
Fibronectin amount, MMP-2 expression, and gelatinase activity in conditioned medium increases in response to CTGF in 3T3 fibroblasts. A, fibroblasts were incubated for 24 h with increasing concentrations of CTGF in serum-free medium. After that, cell extracts were prepared, fractionated by 7.5% SDS-PAGE, and transferred onto nitrocellulose membranes. Western blot analyses were carried out using anti-FN and anti-tubulin antibodies, as explained under “Experimental Procedures.” Tubulin immunostaining is shown as a loading control. B, the graph shows the quantification of FN bands as a ratio to the tubulin bands intensity; the mean and standard error (n = 3) are represented. The p value between control condition and cells treated with 5.0 and 10 ng/ml CTGF was <0.05 (*). C, fibroblasts were incubated for 24 h with different concentrations of CTGF in serum-free medium. Then rqPCR was carried out. The graph shows the quantification of MMP-2 bands as a ratio to the 18 S bands intensity; the mean and standard error are represented. All of the conditions show statistically significant difference (n = 3, p < 0.05). D, fibroblasts were incubated for 48 h with different concentrations of CTGF in serum-free medium. After that, the conditioned medium was collected, and gelatin zymography was carried out. E, serum-free conditioned medium of cells treated for 48 h with different concentrations of CTGF was used in the gelatinase activity assay (n = 3). The enzymatic activity was represented as (A30 - A0/mg) × fV, where A30 is the absorbance of the sample after 30 min of incubation; A0 is the absorbance of the sample at time 0; mg is the amount of protein/well; and fV is the ratio between the total volume of conditioned medium in the well and the volume used in the assay. The p value between control condition and 5.0 ng/ml CTGF was <0.05 (*). The gelatinase activity between 5.0 and 10 ng/ml of CTGF did not show statistically significant difference.
FIGURE 2.
FIGURE 2.
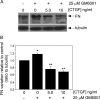
CTGF decreases the amount of fibronectin in 3T3 cells treated with GM-6001. A, fibroblasts were incubated for 24 h with different concentrations of CTGF in serum-free medium in the presence of 25 μm GM-6001. After that, the cell extracts were prepared, fractionated by 7.5% SDS-PAGE and transferred onto nitrocellulose membranes. Western blot analyses were carried out using anti-FN and anti-tubulin antibodies. Tubulin immunostaining is shown as a loading control. B, the graph shows the quantification of FN bands as a ratio to the tubulin bands intensity; the mean and standard error (n = 3) are represented. The p value between the control condition (without GM-6001 and CTGF) and cells treated with CTGF in the presence of GM-6001 was <0.05 (*). The p value between cells treated with GM-6001 without CTGF and cells treated with 5.0 and 10 ng/ml CTGF in the presence of GM-6001 was <0.001 (**).
FIGURE 3.
FIGURE 3.
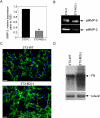
Fibronectin is increased in MMP-2-deficient cells. A stable clone of 3T3 cells expressing shRNA against MMP-2 was produced using lentiviral vectors. This clone was called 3T3-M2(-). A, RNA from control 3T3-C (control cells) and 3T3-M2(-) was isolated. rqPCR was carried out to evaluate the expression of MMP-2 mRNA. The graph shows the quantification of MMP-2 bands as a ratio to the 18 S bands intensity; the mean and standard error (n = 3) are represented. The clone 3T3-M2(-) shows an inhibition of 4.3-fold in MMP-2 expression relative to control cells (p < 0.001). B, conditioned medium from 3T3-C and 3T3-M2(-) cells was collected and gelatin zymography was carried out. The zymogram shows the amount of MMP-2 and MMP-9 present in the conditioned medium of each cell line. C, wild type (WT) and 3T3-M2(-) cells were cultured for 48 h in control conditions and then processed for immunofluorescence, using anti-FN antibodies (green). The nuclei were stained with Hoechst (blue). Scale bar, 10 μm. D, wild type and 3T3-M2(-) cells were incubated for 48 h under control conditions. After that, cell extracts were prepared, fractionated by 7.5% SDS-PAGE and transferred onto nitrocellulose membranes. Western blot analyses were carried out using anti-FN and anti-tubulin antibodies. Tubulin immunostaining is shown as a loading control.
FIGURE 4.
FIGURE 4.
CTGF decreases the amount of fibronectin in MMP-2-deficient cells. A, 3T3-C and 3T3-M2(-) cells were incubated for 24 h with increasing concentrations of CTGF in serum-free medium. After that, cell extracts were prepared, fractionated by 7.5% SDS-PAGE, and transferred onto nitrocellulose membranes. Western blot analyses were carried out using anti-FN and anti-tubulin antibodies. Tubulin immunostaining is shown as a loading control. B, the graph shows the quantification of FN bands as a ratio to the tubulin bands intensity; the mean and standard error (n = 3) are represented. The black bars show the effect of CTGF in 3T3-C cells, and the gray bars show the effect of CTGF in 3T3-M2(-) cells. The p value between control cells without CTGF and control cells treated with 10 and 20 ng/ml CTGF was <0.05 (*). The p value between control cells without CTGF and 3T3-M2(-) cells without CTGF was <0.001 (**). The p value between 3T3-M2(-) cells without CTGF and 3T3-M2(-) cells treated with CTGF was <0.05 (*) and <0.001(**). C, 3T3-C and 3T3-M2(-) cells were incubated for 24 h with different concentrations of CTGF in serum-free medium. After that, cell extracts were prepared, fractionated by 7.5% SDS-PAGE, and transferred onto nitrocellulose membranes. Western blot analyses were carried out using anti-collagen III and anti-tubulin antibodies. Tubulin immunostaining is shown as a loading control.
FIGURE 5.
FIGURE 5.
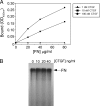
CTGF interacts with fibronectin without degrading it. A, the interaction between CTGF and FN was evaluated using solid phase binding assay as explained under “Experimental Procedures.” The binding analysis was carried out using three concentrations of CTGF (1, 10, and 100 nm). The bound FN was determined as A405 as explained under “Experimental Procedures.” The KD for FN calculated at 100 nm CTGF was 81.2 μg/ml (360.8 nm). B, the putative degradation of FN by CTGF was determined incubating 6 ng of 125I-FN with 0 (control), 10, 20, or 40 ng/ml of CTGF by 24 h at 37 °C. Then the samples were separated by SDS-PAGE. The gel was exposed in a photo-sensitive film.
FIGURE 6.
FIGURE 6.
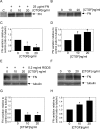
CTGF decreases the amount of fibronectin in 3T3 cells treated with exogenous fibronectin and RGDS peptide. A, 3T3 wild type cells were incubated for 24 h in the presence of 25 μg/ml FN, then were washed, and treated with CTGF for 24 h in serum-free medium. After that, conditioned medium was prepared, fractionated by 7.5% SDS-PAGE, and transferred onto nitrocellulose membranes. Western blot analyses were carried out using anti-FN antibody. As a control for the FN treatment, the wells were incubated with FN in the absence of cells. These wells were subjected to the same treatment that wells with cells. Then the serum-free medium of these control wells was collected to observe the contribution of the FN incubation to the FN observed by Western blot. This condition was called control (lane C). B, 3T3 wild type cells were incubated for 24 h with different concentrations of CTGF in serum-free medium. After that, conditioned medium was prepared, fractionated by 7.5% SDS-PAGE, and transferred onto nitrocellulose membranes. Western blot analyses were carried out using anti-FN antibody. C, the graph shows the quantification of FN bands in conditioned medium from FN-treated cells, as a ratio to the tubulin bands intensity in Western blots from the protein extracts (not shown), used to normalize the loading of the conditioned medium. The mean and standard error (n = 3) are represented. The p value between cells without CTGF and cells treated with 10 and 20 ng/ml CTGF was <0.05 (*). D, the graph shows the quantification of FN bands (control of A) intensity in conditioned medium as a ratio to the tubulin bands intensity in Western blots from the protein extracts (not shown), used to normalize the loading of the conditioned medium. The mean and standard error (n = 3) are represented. The p value between cells without CTGF and cells treated with 10 and 20 ng/ml CTGF was <0.05 (*). E, 3T3 wild type cells were incubated for 24 h with CTGF in the presence of 0.2 mg/ml RGDS peptide in serum-free medium. After that, cell extracts were prepared, fractionated by 7.5% SDS-PAGE, and transferred onto nitrocellulose membranes. Western blot analyses were carried out using anti-FN and anti-tubulin antibodies. Tubulin immunostaining is shown as a loading control. F, 3T3 wild type cells were incubated for 24 h with different concentrations of CTGF in serum-free medium. After that, cell extracts were prepared, fractionated by 7.5% SDS-PAGE, and transferred onto nitrocellulose membranes. Western blot analyses were carried out using anti-FN and anti-tubulin antibodies. Tubulin immunostaining is shown as a loading control. G, the graph shows the quantification of FN bands from RGDS-treated cells as a ratio to the tubulin bands intensity, The mean and standard error (n = 3) are represented. The p value between cells without CTGF and cells treated with 10 and 20 ng/ml CTGF was <0.05 (*). H, the graph shows the quantification of FN bands (control of E) intensity as a ratio to the tubulin bands intensity; the mean and standard error (n = 3) are represented. The p value between cells without CTGF and cells treated with 10 and 20 ng/ml CTGF was <0.05 (*).
FIGURE 7.
FIGURE 7.
The formation of stress fibers and focal adhesion sites in response to CTGF is altered in MMP-2-deficient cells. Control cells and 3T3-M2(-) cells were cultured for 24 h under control conditions or in the presence of 20 ng/ml CTGF and then processed for immunofluorescence, using anti-vinculin antibodies (red) and fluorescein-labeled phalloidin (green) to observe actin fibers. The nuclei were stained with Hoechst (blue). The stress fibers can be observed as several actin fibers (green) across the cell. The focal adhesion sites can be observed as encounter points at the end of actin fibers with vinculin staining (red). A few focal adhesion sites are marked with white arrows. Stress fibers and focal adhesion sites were not observed in response to CTGF in MMP-2-deficient cells. Scale bar, 10 μm.
FIGURE 8.
FIGURE 8.
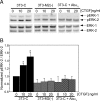
Phosphorylation of ERK proteins is diminished in MMP-2-deficient cells and in cells treated with antibodies against integrin αV. A, 3T3-C, 3T3-M2(-), and 3T3-C + AbαV-pretreated cells (incubation with 5 μg/ml of antibody for 48 h) were serum-starved for 18 h and then incubated for 15 min with increasing concentrations of CTGF in serum-free medium. After that, cell extracts were prepared, fractionated by 10% SDS-PAGE, and transferred onto polyvinylidene difluoride membranes. Western blot analyses were carried out using anti-phospho-ERK and anti-ERK antibodies. ERK immunostaining is shown as a loading control. B, the graph shows the quantification of phosphor-ERK-2 bands as a ratio to the ERK-2 bands intensity; the mean and standard error (n = 3) are represented. The p value between 3T3-C cells without CTGF and 3T3-C cells treated with 10 and 20 ng/ml CTGF was <0.05 (*).
FIGURE 9.
FIGURE 9.
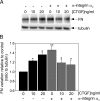
CTGF decreases the amount of FN in cells treated with blocking antibodies against integrin αV. A, wild type fibroblasts under control conditions or pretreated with anti-integrin αV antibodies were incubated for 24 h with the indicated concentrations of CTGF in serum-free medium. After that, cell extracts were prepared, fractionated by 7.5% SDS-PAGE, and transferred onto polyvinylidene difluoride membranes. Western blot analyses were carried out using anti-FN and anti-tubulin antibodies. Tubulin immunostaining is shown as a loading control. B, the graph shows the quantification of FN bands intensity as a ratio to the tubulin bands intensity, the mean and standard error (n = 3) are represented. The p value between control cells without CTGF and control cells treated with 10 and 20 ng/ml CTGF was <0.05 (*). The p value between control cells without CTGF and pretreated cells without CTGF was <0.001 (**). The p value between pretreated cells without CTGF and pretreated cells with 10 and 20 ng/ml CTGF was <0.05 (*).
FIGURE 10.
FIGURE 10.
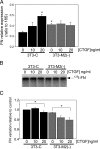
CTGF does not affect mRNA expression of FN, but it does affect the amount of FN in MMP-2-deficient cells. A, control and 3T3-M2(-) cells were incubated for 24 h with the indicated concentrations of CTGF in serumfree medium. Then rqPCR was carried out as explained under “Experimental Procedures.” The graph shows the quantification of FN bands as a ratio to the 18 S bands intensity; the mean and standard error are represented (n = 3). The p value between control cells in the absence of CTGF and control cells treated with 20 ng/ml CTGF was <0.05 (*). The p value between control cells without CTGF and 3T3-M2(-) cells in the absence of CTGF was <0.005 (*). B, control and 3T3-M2(-) cells were incubated with 125I-FN in the presence of 0, 10, and 20 ng/ml CTGF for 24 h in minimum medium. After that, the cell extracts were prepared, fractionated by 7.5% SDS-PAGE, and then the radioactive bands were visualized using phosphorimaging. C, the graph shows the quantification of 125I-FN bands intensity relative to control (3T3-C cells without CTGF); the mean and standard error (n = 3) are represented. The p value between control cells without CTGF and treated with 20 ng/ml CTGF was <0.05 (*). The p value between 3T3-M2(-) cells without CTGF and treated with 20 ng/ml CTGF was <0.05 (*).

Similar articles

Cited by

References

    1. Werb, Z. (1997) Cell 91 439-442 - PubMed
    1. Birkedal-Hansen, H. (1995) Curr. Opin. Cell Biol. 7 728-735 - PubMed
    1. Balcerzak, D., Querengesser, L., Dixon, W. T., and Baracos, V. E. (2001) J. Anim. Sci. 79 94-107 - PubMed
    1. Murphy, G., and Docherty, A. J. (1992) Am. J. Respir. Cell Mol. Biol. 7 120-125 - PubMed
    1. Strongin, A. Y., Collier, I., Bannikov, G., Marmer, B. L., Grant, G. A., and Goldberg, G. I. (1995) J. Biol. Chem. 270 5331-5338 - PubMed

Publication types

MeSH terms

Substances