. 2009 May 8;284(19):13233-43.
doi: 10.1074/jbc.M807535200. Epub 2009 Mar 10.

Epitope-tagged receptor knock-in mice reveal that differential desensitization of alpha2-adrenergic responses is because of ligand-selective internalization

Affiliations

Epitope-tagged receptor knock-in mice reveal that differential desensitization of alpha2-adrenergic responses is because of ligand-selective internalization

Roujian Lu et al. J Biol Chem. .

Abstract

Although ligand-selective regulation of G protein-coupled receptor-mediated signaling and trafficking are well documented, little is known about whether ligand-selective effects occur on endogenous receptors or whether such effects modify the signaling response in physiologically relevant cells. Using a gene targeting approach, we generated a knock-in mouse line, in which N-terminal hemagglutinin epitope-tagged alpha(2A)-adrenergic receptor (AR) expression was driven by the endogenous mouse alpha(2A)AR gene locus. Exploiting this mouse line, we evaluated alpha(2A)AR trafficking and alpha(2A)AR-mediated inhibition of Ca(2+) currents in native sympathetic neurons in response to clonidine and guanfacine, two drugs used for treatment of hypertension, attention deficit and hyperactivity disorder, and enhancement of analgesia through actions on the alpha(2A)AR subtype. We discovered a more rapid desensitization of Ca(2+) current suppression by clonidine than guanfacine, which paralleled a more marked receptor phosphorylation and endocytosis of alpha(2A)AR evoked by clonidine than by guanfacine. Clonidine-induced alpha(2A)AR desensitization, but not receptor phosphorylation, was attenuated by blockade of endocytosis with concanavalin A, indicating a critical role for internalization of alpha(2A)AR in desensitization to this ligand. Our data on endogenous receptor-mediated signaling and trafficking in native cells reveal not only differential regulation of G protein-coupled receptor endocytosis by different ligands, but also a differential contribution of receptor endocytosis to signaling desensitization. Taken together, our data suggest that these HA-alpha(2A)AR knock-in mice will serve as an important model in developing ligands to favor endocytosis or nonendocytosis of receptors, depending on the target cell and pathophysiology being addressed.


Figures

FIGURE 1.
FIGURE 1.
Generation and characterization of HA-α2AAR knock-in mice. A, schematic illustration of gene knock-in at the ADRA2A locus. ADRA2A is an intronless gene. The HA sequence was added to the 5′-end of the coding region. The two triangles flanking the neo cassette represent the loxP sites. The two numbered boldface lines below the gene structure represent the probes used in Southern analyses, and the two paired arrowheads represent the primers used in PCR analysis shown in B and C, respectively. HR, homologous recombination in embryonic stem (ES) cells. F1 heterozygotes bearing the targeted ADRA2A locus were crossed with Cre mice to excise the neo cassette. As outlined under “Experimental Procedures,” the Cre mouse line used in these studies (28) has stable and sufficient expression of the Cre recombinase enzyme in all cells to mediate deletion of any loxP-flanked locus, such as the neo cassette present in our initial targeting vector, in all cells of the mouse. Cre, Cre recombinase-mediated recombination. E, EcoRI restriction enzyme digestion site; B, BamHI digestion site. B, Southern analysis verifies recombination events at the ADRA2A locus. Genomic DNAs digested with EcoRI (left) or BamHI (right) were hybridized with probe 1 or 2, as indicated. Bands reflect changes in genomic DNA fragments shown in A. To validate the recombination, homozygotes were obtained both before and after crossing with ubiquitous Cre mice. WT/WT, WT mice; WT/HA*, HA-α2AAR heterozygote mice before crossing with Cre mice, HA*/HA*, HA-α2AAR homozygotes before crossing with Cre mice; HA/HA, HA-α2AAR homozygous knock-in mice after crossing with Cre mice. C, PCR analysis confirms correct targeting at the ADRA2A locus. PCR was performed using primer pairs shown in A (arrowheads). The targeting events resulted in insertion of a loxP site downstream of the coding region, which shifts the PCR product size from 190 to 280 bp. D-F, knock-in HA-α2AAR has pharmacological properties indistinguishable from the WT α2AAR. D, HA-α2AAR in the knock-in mouse brain has a radioligand saturation binding curve indistinguishable from the endogenous α2AAR in the WT mouse brain. Values represent averages of two mouse brains for each genotype. E, ability of epinephrine to compete for [3H]RX821002 binding is indistinguishable in HA-α2AAR knock-in and WT mouse brains. Values = mean ± S.E., n = 3. F, epinephrine exhibits a similar potency and efficacy in activating α2A AR-evoked [35 S]GTPγS binding in particulate preparations from WT and HA-α2AAR knock-in mouse brains. Values = mean ± S.E., n = 3 for WT and n = 4 for knock-in mice.
FIGURE 2.
FIGURE 2.
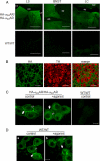
HA-α2AARs are expressed in the brain and SCG of HA-α2AAR knock-in mice (A-C) and exhibit a ligand-evoked redistribution profile indistinguishable from α2AAR in WT mice (C and D). A, HA-like immunoreactivity detected in brain coronal sections of lateral septum (LS), bed nucleus of the stria terminalis (BNST), and locus coeruleus (LC) of the knock-in mice. CC, corpus callosum; LV, lateral ventricle; AC, anterior commissure; Str, striatum; Cer, cerebellum; 4V, 4th ventricle. Scale bar, 500 μm. B, HA-like immunoreactivity detected in SCG sections of the knock-in mice. Sections were co-stained with an antibody against tyrosine hydroxylase (TH). Scale bar, 50 μm. C and D, localization and ligand-induced redistribution of HA-α2AAR in SCG neurons cultured from knock-in mice (C) exhibit a profile indistinguishable from α2AAR in neurons cultured from WT mice (D). Without agonist stimulation, receptors were detected both at the cell surface (solid arrows) and in a perinuclear area (empty arrows). Agonist treatment led to loss of surface receptors and increased receptor density inside the cell. HA staining was observed in SCG neurons cultured from knock-in mice but not in neurons cultured from WT mice (C). α2AAR in SCG neurons cultured from WT mice was detected by an antibody against the C terminus of the α2AAR (D). Scale bar, 10 μm.
FIGURE 3.
FIGURE 3.
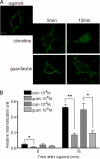
Clonidine and guanfacine induce distinct α2AAR internalization profiles in SCG neurons cultured from HA-α2AAR knock-in mice. A, representative images of HA-α2AAR localization in cultured SCG neurons from knock-in mice in the absence (control) or presence of 10-6 m clonidine or guanfacine for various time periods. Cell surface HA-α2AARs were prelabeled with an HA antibody and then stimulated with clonidine or guanfacine (see “Experimental Procedures”). Scale bar, 10 μm. B, quantification of HA-α2AAR internalization stimulated by clonidine (clon) or guanfacine (guan) at indicated concentrations from immunofluorescence studies shown in A. Values = mean ± S.E. n = 20-25. *, p < 0.01; **, p < 0.001.
FIGURE 4.
FIGURE 4.
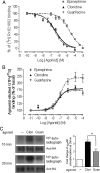
Clonidine and guanfacine induce different levels of α2AAR phosphorylation despite their similar affinity and intrinsic activity at the α2AAR. To evaluate the binding affinity and intrinsic activity of clonidine and guanfacine to the α2AAR and their ability to induce receptor phosphorylation, we evaluated HEK cells stably expressing HA-α2AAR to have sufficient biological material for these biochemical determinations. A, clonidine and guanfacine show similar binding affinities for the α2AAR, based on the ability of these agents to compete for binding of the α2AAR antagonist, [3H]RX821002. Radioligand binding assays were performed in the presence of Gpp(NH)p to eliminate any confounding results due to different receptor-G protein coupling that may be induced by different ligands. The EC50 values for clonidine and guanfacine were 3.63 × 10⁻⁷ and 2.76 × 10⁻⁷ m, respectively, both of which are about 100-fold less than the EC50 for epinephrine (2.18 × 10⁻⁵m). Data shown are the mean ± S.E., n = 3. B, clonidine and guanfacine exhibit similar activities in promoting [35S]GTPγS binding to the α2AAR. The EC50 values for clonidine and guanfacine are 5.16 × 10⁻⁸ and 2.91 × 10⁻⁸ m, respectively. The maximal [35S]GTPγS binding values induced by clonidine and guanfacine are similar, with both about 80% of that for epinephrine; n = 5. C, clonidine (Clon) induced greater detectable α2AAR phosphorylation than guanfacine (Guan). Intact cell phosphorylation assays were performed with or without treatment of 10-6 m clonidine or guanfacine as described under “Experimental Procedures.” Left, representative images of 32P-labeled and total HA-α2AAR following stimulation with clonidine or guanfacine for 10 or 20 min. Right, quantitative data for fold change of α2AAR phosphorylation at the 20-min time point. Values = mean ± S.E. n = 5 for clonidine and n = 4 for guanfacine. *, p < 0.05.
FIGURE 5.
FIGURE 5.
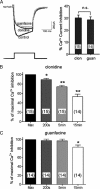
Clonidine and guanfacine acutely evoke similar α2AAR-mediated inhibition of Ca2+ currents in SCG neurons, but the response to clonidine desensitizes more rapidly and extensively. A, clonidine (clon) and guanfacine (guan) treatment caused a similar level of inhibition of Ca2+currents. Left, representative Ca2+ current traces recorded in response to the first pulse; the effect of these agents was reversed after a brief and strong depolarization (second pulse, not shown), which is characteristic of the two pulse protocol. Right, quantitative data of the maximal inhibition of Ca2+ currents by 10-5 m clonidine or guanfacine. Values represent mean ± S.E. Numbers in parentheses represent the number of neurons recorded independently. n.s., not significant. B and C, quantitation of Ca2+ current inhibition at indicated times relative to the maximal inhibition level in response to 10-5 m clonidine (B) or guanfacine (C). For each recording, the maximal Ca2+ current inhibition was arbitrarily defined as 100%, and percent of the maximal inhibition level at different time points was calculated and plotted. Values represent the mean ± S.E. Numbers in parentheses represent the number of neurons recorded independently. *, p < 0.01; **, p < 0.001, when compared with the maximal level.
FIGURE 6.
FIGURE 6.
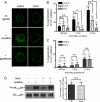
Blockade of α2AAR internalization attenuates desensitization of Ca2+ channel inhibition induced by clonidine but not by guanfacine and has no effect on α2AAR phosphorylation. A, ConA treatment blocks internalization of HA-α2AAR induced by a 15-min incubation with 10-5 m clonidine or guanfacine in SCG neurons. B, ConA and PAO attenuate desensitization of clonidine-elicited inhibition of Ca2+currents at 5- and 15-min time points but not at the 200-s time point in SCG neurons. Neurons were preincubated with ConA (160 μg/ml) or PAO (10 μm) for 20 min before recording and addition of 10-5 mclonidine. *, p < 0.05. n.s., not significant. C, ConA treatment has no effect on desensitization of guanfacine-evoked inhibition of Ca2+ current at the 15-min time point. No significant desensitization by 10-5 m guanfacine can be detected at the 200-s and 5-min time points. Values represent mean ± S.E. Numbers in parentheses represent the number of neurons recorded. n.s., not significant. D, ConA treatment did not alter clonidine-induced α2AAR phosphorylation. HEK cells stably expressing HA-α2AAR were evaluated to have sufficient biological material to detect α2AAR phosphorylation. Left, representative images of 32P-labeled and total HA-α2AAR. Right, quantitative data of fold change of α2AAR phosphorylation in response to 10-5 m clonidine over basal. Values = mean ± S.E., n = 4. n.s., not significant.

Similar articles

Cited by

References

    1. Pierce, K. L., Premont, R. T., and Lefkowitz, R. J. (2002) Nat. Rev. Mol. Cell Biol. 3 639-650 - PubMed
    1. Kohout, T. A., and Lefkowitz, R. J. (2003) Mol. Pharmacol. 63 9-18 - PubMed
    1. Gainetdinov, R. R., Premont, R. T., Bohn, L. M., Lefkowitz, R. J., and Caron, M. G. (2004) Annu. Rev. Neurosci. 27 107-144 - PubMed
    1. Pierce, K. L., and Lefkowitz, R. J. (2001) Nat. Rev. Neurosci. 2 727-733 - PubMed
    1. Shenoy, S. K., and Lefkowitz, R. J. (2003) Biochem. J. 375 503-515 - PMC - PubMed

Publication types

MeSH terms