. 2009 Mar 31;106(13):5389-93.
doi: 10.1073/pnas.0804998106. Epub 2009 Mar 10.

Perceiving electrical stimulation of identified human visual areas

Affiliations

Perceiving electrical stimulation of identified human visual areas

Dona K Murphey et al. Proc Natl Acad Sci U S A. .

Abstract

We studied whether detectable percepts could be produced by electrical stimulation of intracranial electrodes placed over human visual areas identified with fMRI. Identification of areas was confirmed by recording local-field potentials from the electrode, such as face-selective electrical responses from electrodes over the fusiform face area (FFA). The probability of detecting electrical stimulation of a visual area varied with the position of the area in the visual cortical hierarchy. Stimulation of early visual areas including V1, V2, and V3 was almost always detected, whereas stimulation of late visual areas such as FFA was rarely detected. When percepts were elicited from late areas, subjects reported that they were simple shapes and colors, similar to the descriptions of percepts from early areas. There were no reports of elaborate percepts, such as faces, even in areas like FFA, where neurons have complex response properties. For sites eliciting percepts, the detection threshold was determined by varying the stimulation current as subjects performed a forced-choice detection task. Current thresholds were similar for late and early areas. The similarity between both percept quality and threshold across early and late areas suggests the presence of functional microcircuits that link electrical stimulation with perception.


Conflict of interest statement

The authors declare no conflict of interest.

Figures
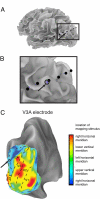
Fig. 1.
Fig. 1.
Identification of an implanted electrode over retinotopic visual cortex. (A) Posterior-lateral view of the gray-white matter boundary of the left hemisphere of a single subject. A strip containing 10 electrodes was implanted subdurally. The location of each electrode on the strip is shown as a black disc, corresponding to the actual size of the electrode. (B) Magnified view of 6 electrodes in Fig. 1A. The patch of cortex closest to each electrode is colored in blue. The circle and arrow identify the cortex under the electrode of interest. (C) Posterior view of a partially inflated cortical surface (at the gray-white matter boundary) with retinotopic fMRI data (same subject as A and B, arrow indicates electrode of interest). Surface coloring corresponds to the location in the visual field that evoked maximal activity from each cortical node. Dorsal visual areas are labeled with dotted lines, indicating visual area boundaries. The electrode is in the area V3A, consistent with previous anatomical and functional studies (28).
Fig. 2.
Fig. 2.
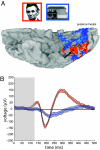
Identification of an implanted electrode over the FFA. (A) Ventral view of the pial surface of a subject's right hemisphere. The fusiform gyrus sits between the collateral sulcus (upper white dashed line) and the inferior temporal sulcus (lower white dashed line). The electrode (black disc indicated with arrow) sits over the FFA, seen as orange surface nodes with significantly greater (P < 10−6) BOLD fMRI response to faces than to places (nodes with stronger responses to places are colored blue). (B) LFPs recorded from the electrode in A. Average response to images of faces (orange) and houses (blue). The gray bar indicates the 125-ms period when each stimulus was presented.
Fig. 3.
Fig. 3.
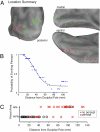
Summary data across all electrodes. (A) The location of 50 electrodes across 10 subjects are plotted as spheres on a single, inflated left hemisphere. The left hemisphere is shown from posterior, medial, and ventral views. Green color indicates that electrical stimulation of the electrode produced a percept. Red color indicates that it did not. (B) In each subject, the distance between the occipital pole and the electrode along the cortical surface was measured. For each distance, the probability of evoking a percept was computed. Each blue point shows the average cortical surface distance and probability for 10 electrodes, calculated with a moving-window average. The black curve shows the best-fit Weibull function. (C) Electrodes were also classified depending on their position in the visual hierarchy as either early (electrodes located in areas V1, V2, V3, V3a, and V4) or late (all other areas). Electrodes that produced a percept are shown as a black O, electrodes that did not are shown as a red X. Most early electrodes (symbols at the bottom) produced a percept, most late electrodes (symbols at the top) did not. There was a rough correspondence between early and late classification and distance from the occipital pole (shown on the x axis).
Fig. 4.
Fig. 4.
Determining thresholds for detecting electrical stimulation. (A) Each trial contained 2 300-ms epochs, marked by the words “One” and “Two.” The current amplitude (and the epoch containing the stimulus) varied from trial to trial. The subject's task was to detect the epoch in which the stimulation was delivered. A shows a sample trial in which a high amplitude current train was delivered in the second epoch, the subject responded by pressing mouse button Two, and received positive feedback. (B) A sample trial in which a low amplitude current was delivered in the first epoch, the subject responded by pressing mouse button Two, and received negative feedback. (C) Behavioral performance at a single V2 electrode. Each point shows the performance at different stimulation currents (error bars, 95% confidence intervals). The black curve is the best-fit psychometric function. The dashed line shows the threshold of 2.53 mA (95% CI 2.36–2.66 uA). (D) Correlation between threshold and distance from the occipital pole across electrodes (error bars, 95% confidence interval for detection threshold). Dashed line shows linear fit (r = 0.48, P = 0.03).

References

    1. Salzman CD, Murasugi CM, Britten KH, Newsome WT. Microstimulation in visual area MT: Effects on direction discrimination performance. J Neurosci. 1992;12:2331–2355. - PMC - PubMed
    1. Britten KH, van Wezel RJ. Electrical microstimulation of cortical area MST biases heading perception in monkeys. Nat Neurosci. 1998;1:59–63. - PubMed
    1. Afraz SR, Kiani R, Esteky H. Microstimulation of inferotemporal cortex influences face categorization. Nature. 2006;442:692–695. - PubMed
    1. Tehovnik EJ, Slocum WM. Phosphene induction by microstimulation of macaque V1. Brain Res Rev. 2007;53:337–343. - PMC - PubMed
    1. Penfield WR, Rasmussen T. The Cerebral Cortex of Man: A Clinical Study of Localization of Function. New York: Macmillan; 1957.

Publication types

LinkOut - more resources