. 2009 May 15;25(10):1223-30.
doi: 10.1093/bioinformatics/btp119. Epub 2009 Mar 10.

Joint estimation of copy number variation and reference intensities on multiple DNA arrays using GADA

Affiliations

Joint estimation of copy number variation and reference intensities on multiple DNA arrays using GADA

Roger Pique-Regi et al. Bioinformatics. .

Abstract

Motivation: The complexity of a large number of recently discovered copy number polymorphisms is much higher than initially thought, thus making it more difficult to detect them in the presence of significant measurement noise. In this scenario, separate normalization and segmentation is prone to lead to many false detections of changes in copy number. New approaches capable of jointly modeling the copy number and the non-copy number (noise) hybridization effects across multiple samples will potentially lead to more accurate results.

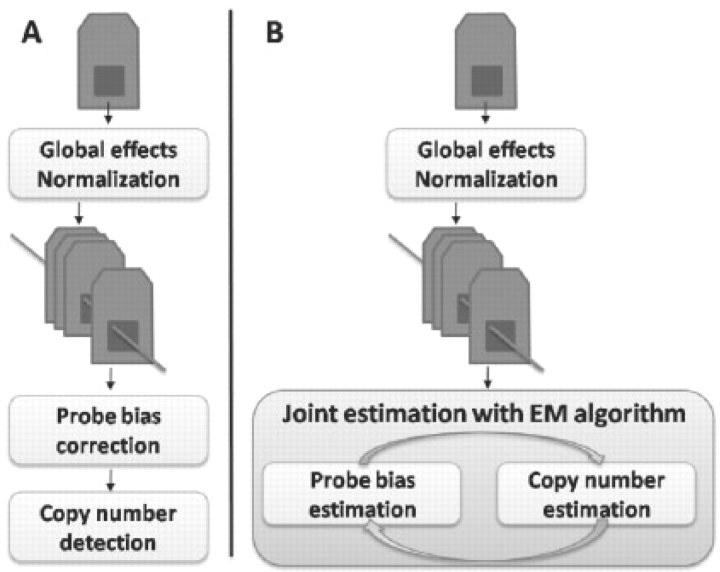
Methods: In this article, the genome alteration detection analysis (GADA) approach introduced in our previous work is extended to a multiple sample model. The copy number component is independent for each sample and uses a sparse Bayesian prior, while the reference hybridization level is not necessarily sparse but identical on all samples. The expectation maximization (EM) algorithm used to fit the model iteratively determines whether the observed hybridization levels are more likely due to a copy number variation or to a shared hybridization bias.

Results: The new proposed approach is compared with the currently used strategy of separate normalization followed by independent segmentation of each array. Real microarray data obtained from HapMap samples are randomly partitioned to create different reference sets. Using the new approach, copy number and reference intensity estimates are significantly less variable if the reference set changes; and a higher consistency on copy numbers detected within HapMap family trios is obtained. Finally, the running time to fit the model grows linearly in the number samples and probes.

Availability: http://biron.usc.edu/~piquereg/GADA.


Figures

Fig. 1.
Fig. 1.
Block diagram depicting (A) the typical workflow used to analyze copy number with separate preprocessing, and (B) the new proposed workflow using a joint estimation model for CNVs and the probe hybridization intensities.
Fig. 2.
Fig. 2.
Graphical representation of the observation model with the reference already corrected rm=0 on a chromosome section containing two variations as an example. The underlying mean hybridization intensity xm is piece-wise constant (PWC) and discrete valued (DIS), since it depends on the number of DNA copies. The observed hybridization intensities ym do not follow this expected behavior due to degradation by hybridization noise ɛm.
Fig. 3.
Fig. 3.
Step vector fi with a breakpoint between probe i and i+1.
Fig. 4.
Fig. 4.
Illustration of the observation model. Colors represent the observed hybridization intensities and the relative copy number change (blue = loss ‘−1’, red = gain ‘+1’, green = neutral ‘0’). (A) The true underlying CNV component with two CNVRs (CNVR-1 around m = 2500 and CNVR-2 around m = 7500). (B) Simulated array hybridization intensities degraded by noise ɛn and a systematic measurement bias r. (C) Copy number profile using GADA on non-normalized data. (D) Data after reference subtraction estimated by separate median preprocessing (SMN). (E) Copy number profile using GADA-SMN. (F) Copy number profile estimated using GADA-JRN.
Fig. 5.
Fig. 5.
Variability on the copy number estimates if the set of reference samples changes.
Fig. 6.
Fig. 6.
Consistency of the copy number estimates on HapMap trios if the set of reference samples changes.
Fig. 7.
Fig. 7.
Consistency within HapMap trios using a different sparseness setting T. The dashed and solid lines correspond to a 90 (CEU) and 180 (CEU+YRI) sample reference set, respectively. The cloud of points are the FTCR values obtained from 100 randomly formed trios. The FTCR values of GADA-JRN (blue) are smaller than those of GADA-SMN (green).
Fig. 8.
Fig. 8.
Section of the chromosome 17 that contains an already known CNV. Each row corresponds to one of the 90 CEU HapMap samples and are grouped in trios (father, son/daughter, mother) delimited by horizontal dotted lines. On the left of the thick vertical line are shown the CNVs estimated using GADA-SMN using a reference set of 90 and 180 reference samples. On the right, copy number estimated using GADA-JRN shows a higher consistency when the reference set is changed as well as within HapMap trios.
Fig. 9.
Fig. 9.
Computational time required to fit the model is linear on the number of samples for both approaches. Execution times required to process the models are measured on the same machine.

References

    1. Affymetrix Genome-wide human snp array 6.0 sample data set. 2007 Available at http://www.affymetrix.com/support/technical/sample_data/genomewide_snp6\...(last accessed date February 17, 2009)
    1. Affymetrix Genotyping Console 3.0.1 User Manual. 2008 Available at ftp://www.affymetrix.com/(last accessed date February 17, 2009)
    1. Bengtsson H, et al. Estimation and assessment of raw copy numbers at the single locus level. Bioinformatics. 2008;24:759–767. - PubMed
    1. Diskin SJ, et al. Adjustment of genomic waves in signal intensities from whole-genome SNP genotyping platforms. Nucleic Acids Res. 2008;36:e126. - PMC - PubMed
    1. Feuk L, et al. Structural variation in the human genome. Nat. Rev. Genet. 2006;7:85–97. - PubMed

Publication types

LinkOut - more resources