. 2009 Mar;7(3):319-29.
doi: 10.1158/1541-7786.MCR-08-0227. Epub 2009 Mar 10.

Extracellular matrix-induced gene expression in human breast cancer cells

Affiliations

Extracellular matrix-induced gene expression in human breast cancer cells

Nandor Garamszegi et al. Mol Cancer Res. 2009 Mar.

Abstract

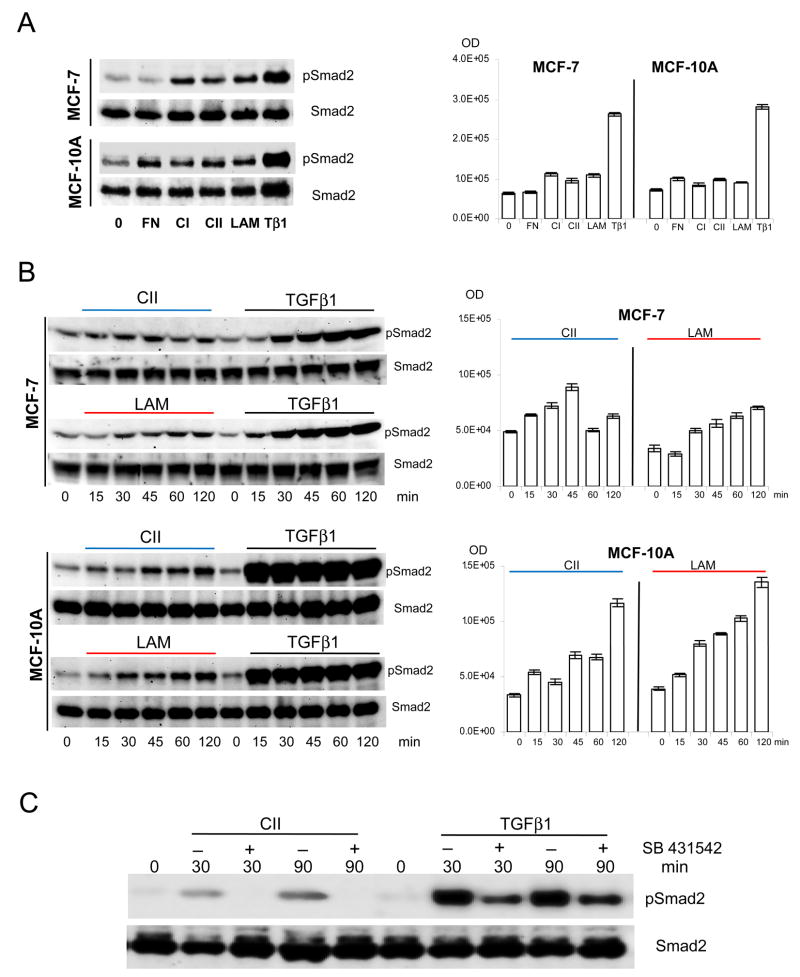
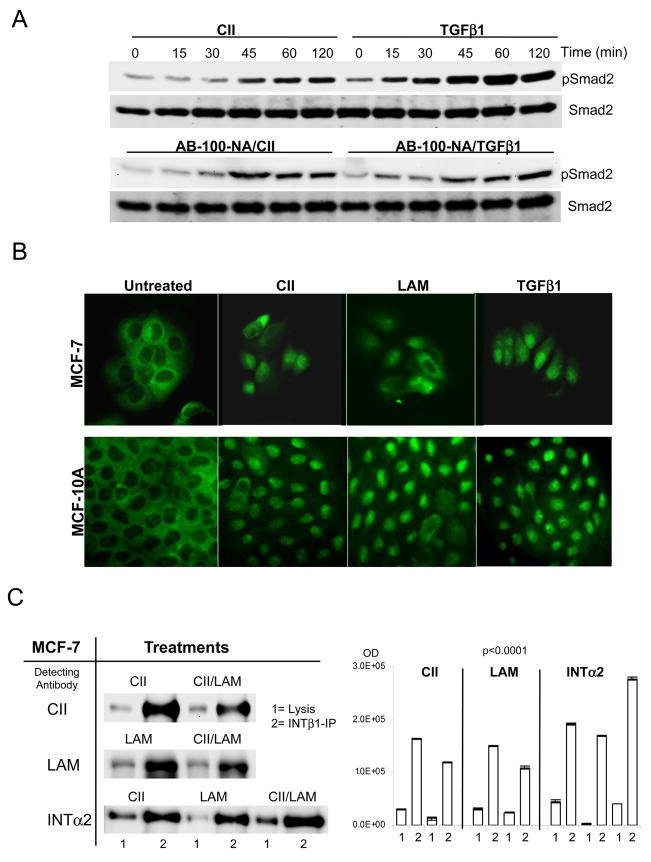
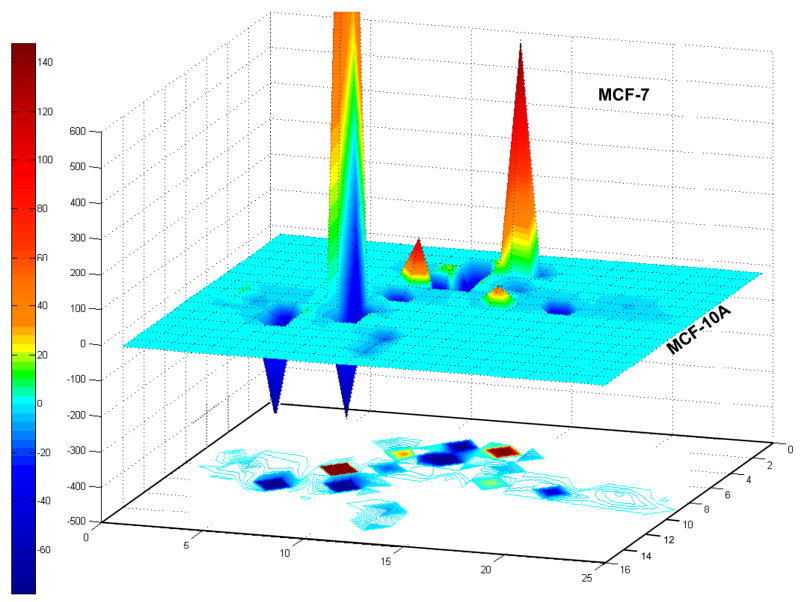
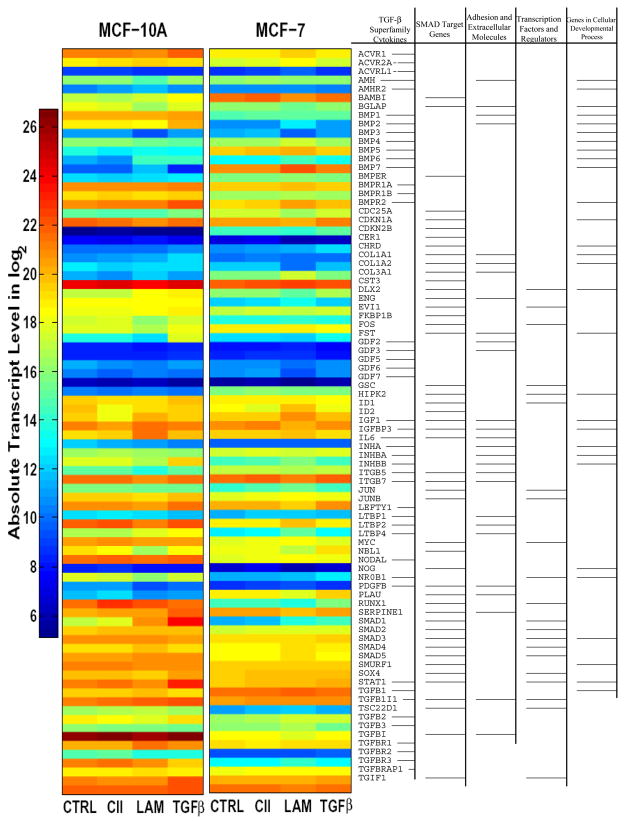
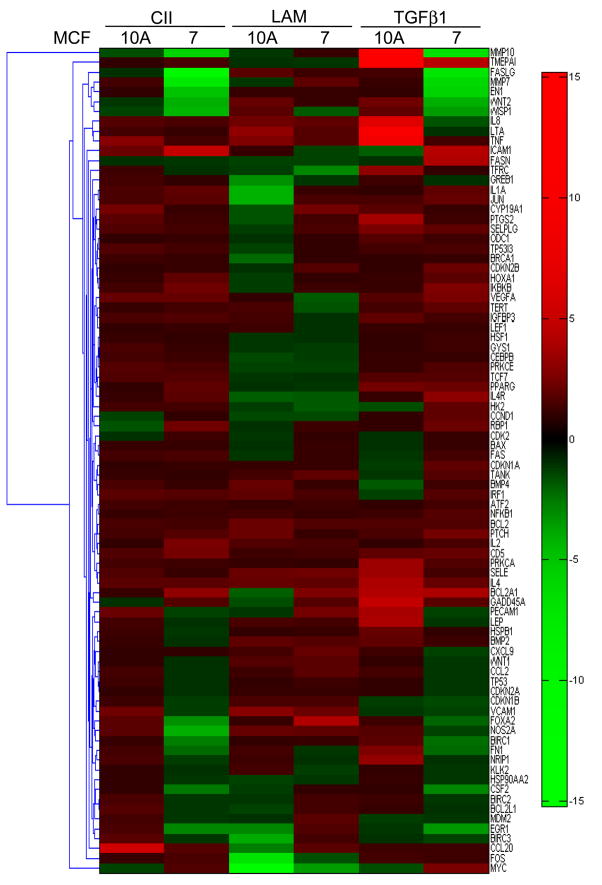
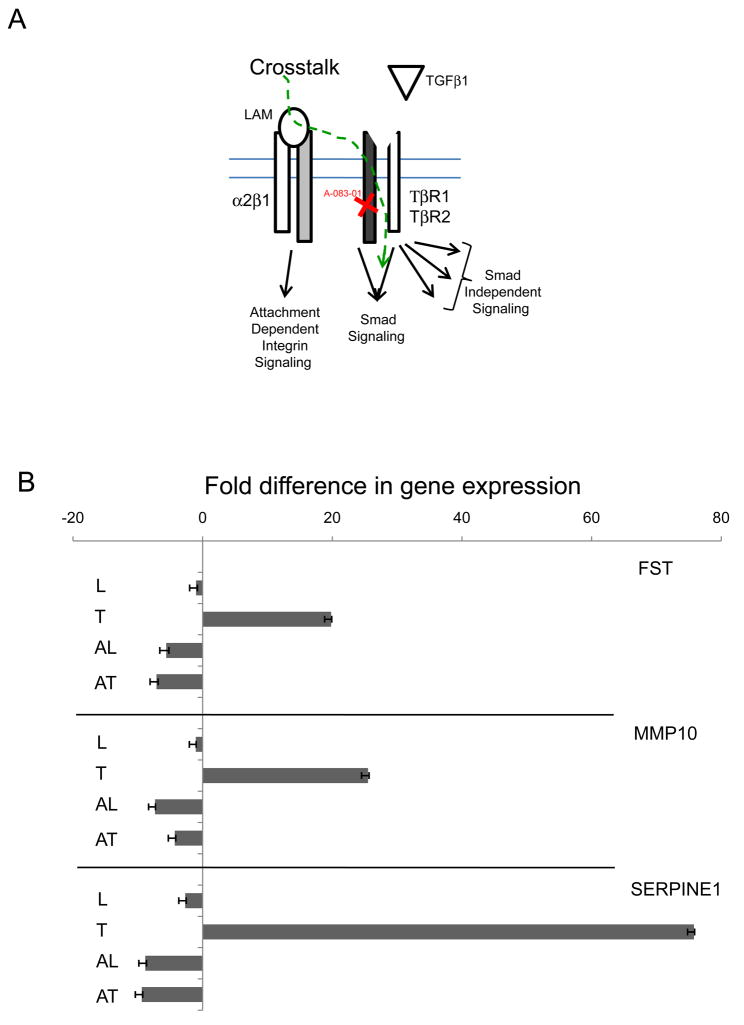
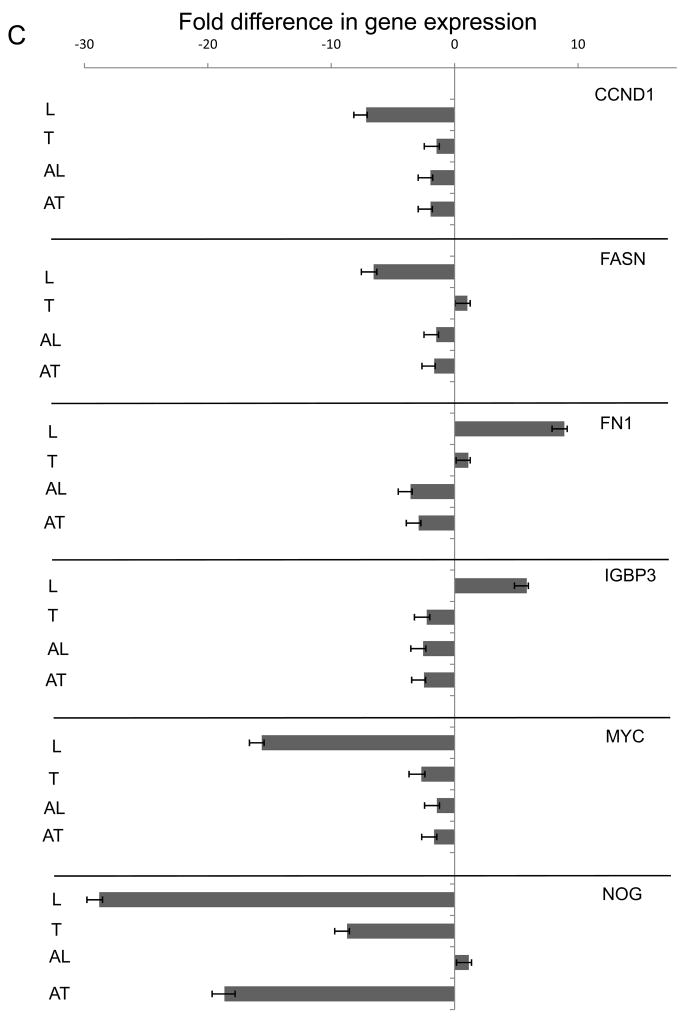
Extracellular matrix (ECM) molecules modify gene expression through attachment-dependent (focal adhesion-related) integrin receptor signaling. It was previously unknown whether the same molecules acting as soluble peptides could generate signal cascades without the associated mechanical anchoring, a condition that may be encountered during matrix remodeling and degradation and relevant to invasion and metastatic processes. In the current study, the role of ECM ligand-regulated gene expression through this attachment-independent process was examined. It was observed that fibronectin, laminin, and collagen type I and II induce Smad2 activation in MCF-10A and MCF-7 cells. This activation is not caused by transforming growth factor (TGF)-beta ligand contamination or autocrine TGF involvement and is 3- to 5-fold less robust than the TGF-beta1 ligand. The resulting nuclear translocation of Smad4 in response to ECM ligand indicates downstream transcriptional responses occurring. Coimmunoprecipitation experiments determined that collagen type II and laminin act through interaction with integrin alpha(2)beta(1) receptor complex. The ECM ligand-induced Smad activation (termed signaling crosstalk) resulted in cell type and ligand-specific transcriptional changes, which are distinct from the TGF-beta ligand-induced responses. These findings show that cell-matrix communication is more complex than previously thought. Soluble ECM peptides drive transcriptional regulation through corresponding adhesion and non-attachment-related processes. The resultant gene expressional patterns correlate with pathway activity and not by the extent of Smad activation. These results extend the complexity and the existing paradigms of ECM-cell communication to ECM ligand regulation without the necessity of mechanical coupling.


Figures

Figure 1
Figure 1
The MCF cells were handled, plated, synchronized, treated, and harvested as described under Material and Methods section. A. The Smad activation (pSmad2) was tested without ligand (0), with fibronectin (FN), type I and II collagen (CI, CII), and laminin (LAM) (all at 50 μg/ml) and TGFβ1 (at 10 ng/ml) at 45 minutes. B. The time curve for Smad activation is comparable to the known activation kinetics with the observation of limited effectiveness in accumulation of generated pSmad2 signal by ECM treatments. Compare MCF-7 CII and LAM treatments (pSmad2 and Smad2 lanes), vs. MCF-10A CII and LAM and their representative densitometry results at right. The significance of ECM treatments were analyzed on raw images acquired by UVP Bio-Imager (supplied by the software) in triplicates, and then subjected to one-way ANOVA analysis (MATLAB 7.5.0) to establish the probability values (p). The difference in densitometry results of (A) and (B) were significant, p<0.001. C. The p100 plates were pre-incubated with SB-431542 for 30 minutes at 5.0 μM final concentration at 37°C in presence of 5% CO2 before pathway induction with CII and TGFβ1 exposures as above. The parallel samples were then harvested at indicated time points, pelleted, snap frozen in liquid nitrogen, and stored at −80°C until use. 125.0 μg standardized total protein was subjected to SDS-PAGE analysis and western blotting.
Figure 2
Figure 2
The cells were treated as described in the materials and methods section. A. Parallel plates were pre-treated with pan-specific AB-100-NA TGFβ neutralizing antibody (R&D with ND50 against hTGFβ1, pTGFβ1.2, pTGFβ2, rcTGFβ3 and raTGFβ5 as 5.0, 1.0, 15.0, 4.0, 1.0 μg/ml respectively). Used 25 μg/ml concentrations for 2 hours (RT) to neutralize exogenously added and endogenous cellular production, then standard activation time curve was established with 50 μg/ml CII, and 2.5 ng/ml TGFβ1 as control. For Smad4 nuclear translocation, MCF-10A and MCF-7 cells were plated at 3×10⁵ cell/well concentration in 6 well plates and synchronised overnight in serum free media then treated as above. B. Following one hour incubation the cells were washed, fixed and processed with Smad4 primary antibody overnight, followed with Alexa-488 secondary antibody for two hours. The images were acquired on Zeiss AxioII microscope with GFP/FITC filter set. C. The CII and LAM are the major peptides for integrin α2β1 receptor complex. After lysis and quantization, 2.0 mg total protein were subjected to integrinβ1 (INTβ1-IP bands 2) for 2 hours then precipitated overnight at 4°C. The ECM treatments are competing (signal down-regulation is less than 50%) for the same receptor population by combined CII/LAM treatments (detecting antibodies [left] pre-treatments [right] with CII detection upper, and LAM detection lanes at centre. Corresponding densitometry, left, and centre). For validation of the right receptor complex pull-down, integrinα2 detection was used (INTα2 lane at bottom, IP bands 2, treatments CII, LAM, CII/LAM, and INTα2 densitometry right). The respective Smad2 bands are generated by stripping and re-probing the membranes. Western blots were repeated in duplicates and corresponding densitometry (right panels) analysis of raw acquired images (UVP imager software) was normalized to Smad2 signals. Statistical analysis was performed as under Figure 1, p=0.0001 was considered highly significant.
Figure 3
Figure 3
Experiments were performed in triplicates, and 5.0 μg total RNA was used to generate cDNA. for each plate. The analysis templates for each assay are provided by the SA Biosciences Co. web page (www.superarray.com) which uses 2−ΔΔCt method to calculate fold differences from the QPCR Crossing points (Ct) with confidence analysis T-Test data for each gene investigated. The fold differences then were analyzed for functional Venn groups (Supplemental Material) and the generated gene distribution representative matrix (missing or empty data set to 0) was visualized in MATLAB to give the 3D representation of expressional values and the underlying contours representing the intensity and topological distribution of these changes.
Figure 4
Figure 4
Real-time polymerase chain reaction with SYBR Green master mix were used to quantify the expression levels of 84 genes ontologically related and regulated by TGFβ/BMP Signalling pathway, or the 84 genes of Signal Transduction Pathway Finder specific arrays (SA Biosciences, Frederick, MD). The heat-map shows absolute mRNA copy numbers which were calculated from PCR cycle thresholds (Cts, Fig. 4). For example, on the color coded log2 scale, a value of 10 represents 210 or 1024 transcripts. Two endogenous controls, GAPDH and ACTB, were used for normalization. Functional gene clustering (with major groups according to the array manual) indicated at right. In the Signal Transduction Pathway Finder Array (Fig. 5), the fold expression differences were analyzed through the SA Biosciences webpage, then transferred into MATLAB and visualized with the Bioinformatics Toolbox Clustergram function. All experiments were run in triplicates.
Figure 5
Figure 5
Real-time polymerase chain reaction with SYBR Green master mix were used to quantify the expression levels of 84 genes ontologically related and regulated by TGFβ/BMP Signalling pathway, or the 84 genes of Signal Transduction Pathway Finder specific arrays (SA Biosciences, Frederick, MD). The heat-map shows absolute mRNA copy numbers which were calculated from PCR cycle thresholds (Cts, Fig. 4). For example, on the color coded log2 scale, a value of 10 represents 210 or 1024 transcripts. Two endogenous controls, GAPDH and ACTB, were used for normalization. Functional gene clustering (with major groups according to the array manual) indicated at right. In the Signal Transduction Pathway Finder Array (Fig. 5), the fold expression differences were analyzed through the SA Biosciences webpage, then transferred into MATLAB and visualized with the Bioinformatics Toolbox Clustergram function. All experiments were run in triplicates.
Figure 6
Figure 6
Parallel triplicate experiments were plated and synchronized as described in the Material and Methods section. A-083-01 (5μM) pre-treatment were used (30 minutes) on selected samples followed by LAM and TGFβ1 exposure alone and in combination with the inhibitor. Samples were harvested after 4-hour incubation to enhance the stable expressional profile changes. Selected genes were assayed on cDNA library generated (Materials and Methods) by ABI TaqMan probes (Supplemental Table 2) on ABI 7900 HT Fast Real Time QPCR instrument. The results were transferred to Excel (Microsoft) and graphed with error bars generated by standard deviation of Ct values from the three independent experiments.
Figure 6
Figure 6
Parallel triplicate experiments were plated and synchronized as described in the Material and Methods section. A-083-01 (5μM) pre-treatment were used (30 minutes) on selected samples followed by LAM and TGFβ1 exposure alone and in combination with the inhibitor. Samples were harvested after 4-hour incubation to enhance the stable expressional profile changes. Selected genes were assayed on cDNA library generated (Materials and Methods) by ABI TaqMan probes (Supplemental Table 2) on ABI 7900 HT Fast Real Time QPCR instrument. The results were transferred to Excel (Microsoft) and graphed with error bars generated by standard deviation of Ct values from the three independent experiments.

References

    1. Bissell MJ, Radisky DC, Rizki A, Weaver VM, Petersen OW. The organizing principle: microenvironmental influences in the normal and malignant breast. Differentiation. 2002;70(9–10):537–46. - PMC - PubMed
    1. Fata JE, Werb Z, Bissell MJ. Regulation of mammary gland branching morphogenesis by the extracellular matrix and its remodeling enzymes. Breast Cancer Res. 2004;6(1):1–11. - PMC - PubMed
    1. Kalluri R, Zeisberg M. Fibroblasts in cancer. Nat Rev Cancer. 2006;6(5):392–401. - PubMed
    1. Thiery JP. Epithelial-mesenchymal transitions in tumour progression. Nat Rev Cancer. 2002;2(6):442–54. - PubMed
    1. Atley LM, Mort JS, Lalumiere M, Eyre DR. Proteolysis of human bone collagen by cathepsin K: characterization of the cleavage sites generating by cross-linked N-telopeptide neoepitope. Bone. 2000;26(3):241–7. - PubMed

Publication types

MeSH terms