. 2009 Mar 15;69(6):2260-8.
doi: 10.1158/0008-5472.CAN-07-5575. Epub 2009 Mar 10.

Bicarbonate increases tumor pH and inhibits spontaneous metastases

Affiliations

Bicarbonate increases tumor pH and inhibits spontaneous metastases

Ian F Robey et al. Cancer Res. .

Abstract

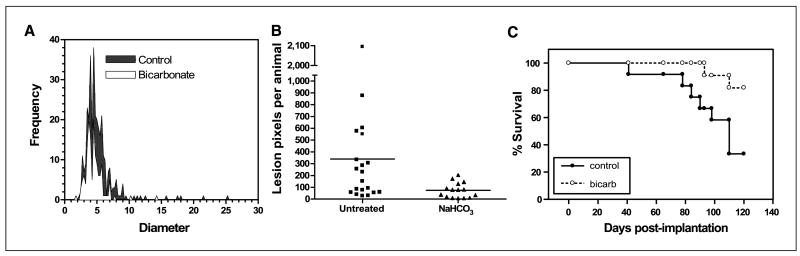
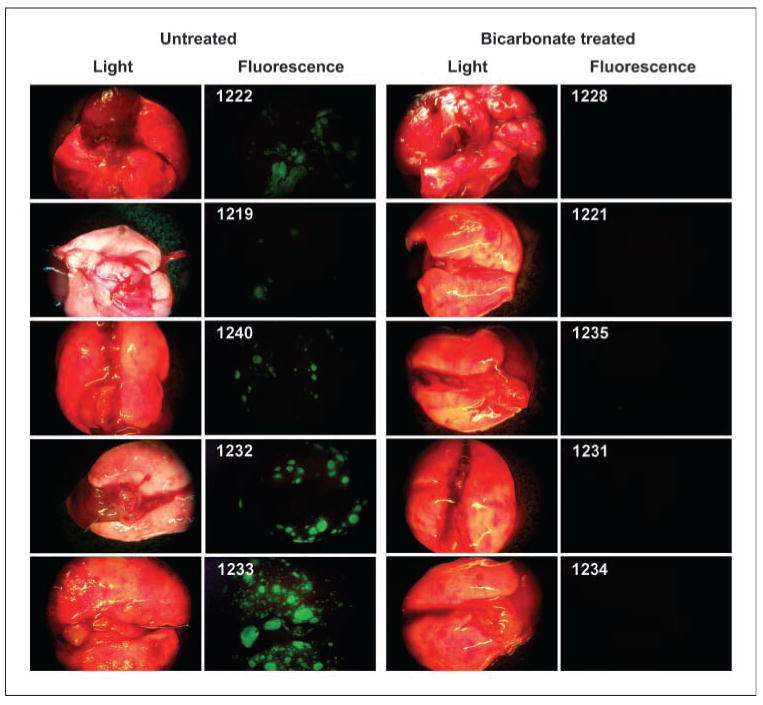
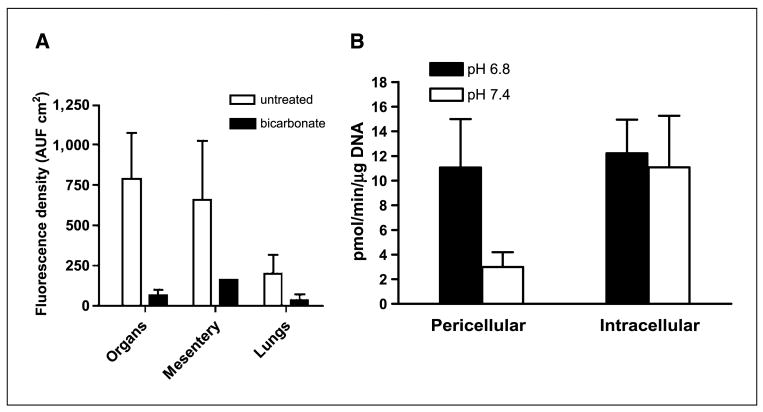
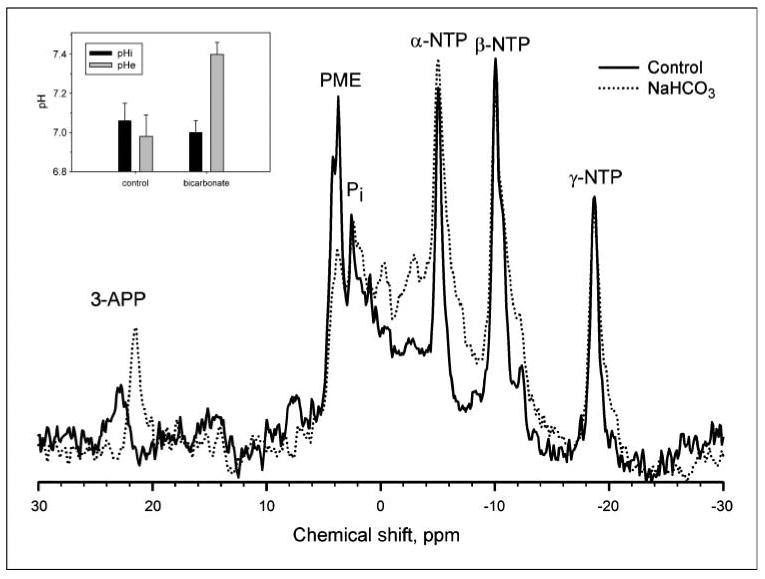
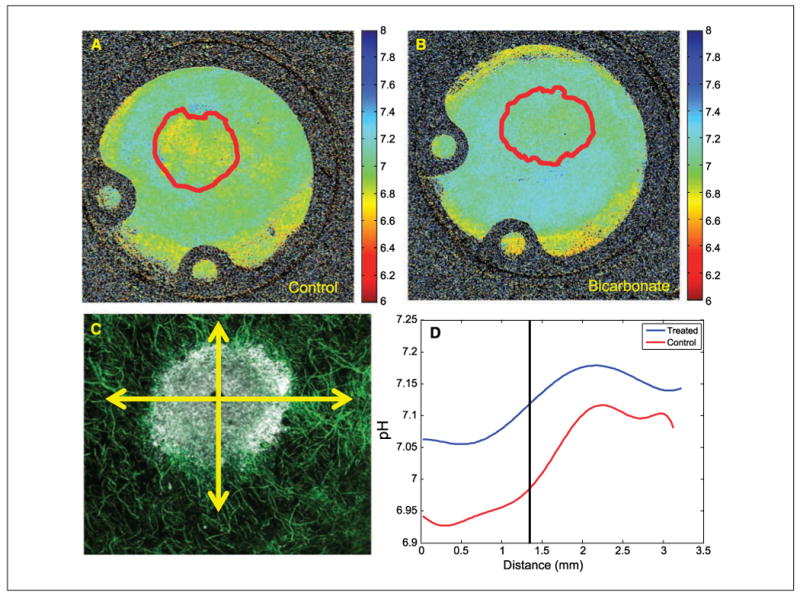
The external pH of solid tumors is acidic as a consequence of increased metabolism of glucose and poor perfusion. Acid pH has been shown to stimulate tumor cell invasion and metastasis in vitro and in cells before tail vein injection in vivo. The present study investigates whether inhibition of this tumor acidity will reduce the incidence of in vivo metastases. Here, we show that oral NaHCO(3) selectively increased the pH of tumors and reduced the formation of spontaneous metastases in mouse models of metastatic breast cancer. This treatment regimen was shown to significantly increase the extracellular pH, but not the intracellular pH, of tumors by (31)P magnetic resonance spectroscopy and the export of acid from growing tumors by fluorescence microscopy of tumors grown in window chambers. NaHCO(3) therapy also reduced the rate of lymph node involvement, yet did not affect the levels of circulating tumor cells, suggesting that reduced organ metastases were not due to increased intravasation. In contrast, NaHCO(3) therapy significantly reduced the formation of hepatic metastases following intrasplenic injection, suggesting that it did inhibit extravasation and colonization. In tail vein injections of alternative cancer models, bicarbonate had mixed results, inhibiting the formation of metastases from PC3M prostate cancer cells, but not those of B16 melanoma. Although the mechanism of this therapy is not known with certainty, low pH was shown to increase the release of active cathepsin B, an important matrix remodeling protease.


Conflict of interest statement

Disclosure of Potential Conflicts of Interest: The authors disclosed no potential conflicts of interest.

Figures

Figure 1
Figure 1
Effect of NaHCO3 on metastases and survival. MDA-MB-231 were obtained from American Type Culture Collection and maintained in growth media (DMEM/F-12 supplemented with 10% FBS) at 37°C with 5% CO2 in a humidified atmosphere. These cells were stably transfected with expression vectors for hygromycin-resistant pcDNA3.1/LacZ (Invitrogen). These β-gal–labeled MDA-MB-231 cells (107), suspended in 0.2 mL of 0.8% sterile saline, were injected s.c. into the left inguinal mammary fat pads of 6-wk-old female SCID mice. Mice (n = 8) were started on drinking water (ad libitum) supplemented with 200 mmol/L NaHCO3 at 6 d postinjection and maintained along with untreated animals (n = 8). After 30 d of primary tumor growth, the animals were sacrificed and the β-gal–positive lung lesions were counted and sized after staining, as shown in A. Mean lesion diameters (P < 0.0001) and frequencies (P = 0.0342) were significantly different between the two groups as determined by two-tailed unpaired t test with Welch's correction for unequal variances. In a repeat of this experiment, 106 β-gal-MDA-MB-231 cells were injected into inguinal mammary fat pads, and control (n = 9) and NaHCO3-treated (n = 15) animals were maintained for 60 d before sacrifice. In this experiment, lung images were analyzed using ImagePro Plus to determine the metastatic tumor burden by counting the number of β-gal–positive pixels per animal. B, numbers of lung lesions per animal following 60 d of growth in the presence of NaHCO3 in drinking water. The frequency of lesions per animal in the NaHCO3-treated mice was compared with that in untreated controls by unpaired t test (P = 0.0004). In a third experiment, MDA-MB-231 cells were stably transfected to express neomycin-resistant pcDNA3/EGFP (a gift from Peter Ratcliffe, Oxford University, Oxford, United Kingdom). MDA-MB-231/eGFP cells (6.5 × 10⁶) were injected into inguinal mammary fat pads of animals that were randomized into bicarbonate and control groups (n = 12 per group) 6 d postinoculation. Tumors were allowed to grow for 5 to 6 wk (to a volume of ∼600 mm3), at which time they were surgically removed. If the primary regrew (as was the case in 9 of 24 animals), it was resected again. Animals were monitored biweekly and maintained on bicarbonate or water until they evidenced a lymph node lesion >300 mm3 in size, at which time they were sacrificed and necropsied by examination with a fluorescence dissecting scope. Data from this experiment are plotted as a Kaplan-Meier survival curve (C). The difference in the survival curve for the bicarbonate versus control animals was tested using the log-rank test (P = 0.027).
Figure 2
Figure 2
Lung metastases. Images were obtained at time of sacrifice from individual (numbered) mice in control and bicarbonate groups of the experiment shown in Fig. 1C. At time of necropsy, organ and lymph node green fluorescent tumor metastases from necropsies were detected by the Illumatool Bright Light System (LT-9500) using a 470 nm/40 nm excitation filter (Lightools Research) and imaged using a Stereomaster 4× dissecting microscope (Fisher Scientific) with mounted DC290 Zoom digital camera (Eastman Kodak). Images were captured at the same focal plane in the presence of 480-nm excitation and >490-nm filtered emission with an exposure time of 4 s for GFP images and 1/10 s for white-light illumination. Image data were analyzed with ImageJ (http://rsb.info.nih.gov/ij/) by segmenting the green channel and counting total positive pixels per field.
Figure 3
Figure 3
Metastases and cathepsin B activity. A, at time of sacrifice, animals in the survival experiment shown in Fig. 1C were necropsied and metastases were quantified by fluorescence. Images were captured as described in Fig. 1C and fluorescence was quantified following RGB segmentation using ImageJ analysis software. Columns, average fluorescence pixel densities (fluorescence intensities × area) for lymph nodes, visceral organs, mesentery, and lungs; bars, SE. AUF, arbitrary units of fluorescence. B, red fluorescent protein–expressing MDA-MB-231 tumor cells were incubated at low and high pH values for 4 d, and then overnight in 0.2% serum media, followed by assessment of pericellular and intracellular cathepsin B activity in live cells via a “real time assay”, as described in Materials and Methods.
Figure 4
Figure 4
The effect of NaHCO3 treatment on tumor pH. All in vivo measurements were done at 4.7 T on a Bruker Biospec magnetic resonance imaging spectrometer equipped with a 14 G/cm self-shielded gradient insert, using volume excitation and home-built solenoid coils for reception. Image-guided volume-selective 31P magnetic resonance spectra of tumors in anesthetized mice were acquired as described in ref. 14. The pHe and pHi were measured from the chemical shifts of exogenous 3-aminopropylphosphonate and endogenous inorganic phosphate, respectively (17). For spectroscopy of tumors, 0.4 mL of 0.24 mol/L 3-aminopropylphosphonate was administered i.p. to mice a few minutes before anesthetization. Following anesthetization, a further 0.4 mL of 3-aminopropylphosphonate was injected i.p., and the mouse prepared for 31P MRS as before. This figure illustrates representative 31P magnetic resonance spectra from control (solid) and NaHCO3-treated (dotted) MDA-MB-231 tumor xenografts. 3-APP, 3-aminopropylphosphonate; Pi, endogenous inorganic phosphate; PME, phosphomonoesters; NTP, nucleoside triphosphate. Inset, columns, average values for tumor pHi (P = 0.89) and pHe (P = 0.01) in the absence and presence of bicarbonate treatment (n = 6 mice each); bars, SE. Details of the acquisition and processing parameters are provided in Materials and Methods.
Figure 5
Figure 5
Microscopic pH gradients in window chambers. Tumors were inoculated into window chamber as described in Materials and Methods. pHe was measured following injection of SNARF-1 free acid by excitation with a He/Ne laser at 543 nm and emissions were collected in channel 1 with a 595/50-nm bandpass and in channel 2 with a 640-nm-long pass filter. Confocal images were converted to .tif format using ImageJ (http://rsb.info.nih.gov/ij/); respective background images were subtracted from each fluorescence image (red channel, blue channel); and image was then smoothed with a 2 × 2 kernel. The two images were then divided, subsequently removing zeros and not-a-numbers (NANs), creating a ratiometric image. The in vitro pH calibration was then applied to every pixel in the ratiometric image. Regions of interest were drawn around the tumor, the proximal peritumor region, and the distal “normal” region, and the mean pHe was calculated in these regions. The spatial pH distribution was calculated by drawing an intensity profile (5 pixels wide) from the center of the tumor out to the edge of the window chamber. These profiles were drawn in four orthogonal radial directions, originating from the tumor centroid. The pH profiles were then aligned so that they coincided at the tumor margin using the GFP image to determine the tumor rim. Representative pHe images are shown for untreated (A) and bicarbonate-treated (B) mice (10 × field of view, 12.5 mm). Red lines, region of interest of tumor, defined by GFP images, shown in Supplementary Fig. S2. C, merged confocal image of tumor (white) surrounded by a labeled microvascular network (green). Radial lines, directions along which pHe values were measured. D, least-square fit across all directions and all tumors showing pHe distributions along radial lines for control and bicarbonate-treated tumors. “0” is centroid of tumor, and vertical line indicates tumor edge.

References

    1. Griffiths JR. Are cancer cells acidic? Br J Cancer. 1991;64:425–7. - PMC - PubMed
    1. Vaupel P, Kallinowski F, Okunieff P. Blood flow, oxygen and nutrient supply, and metabolic microenvironment of human tumors: a review. Cancer Res. 1989;49:6449–65. - PubMed
    1. Wike-Hooley JL, Haveman J, Reinhold HS. The relevance of tumour pH to the treatment of malignant disease. Radiother Oncol. 1984;2:343–66. - PubMed
    1. Gatenby RA, Gawlinski ET. Mathematical models of tumour invasion mediated by transformation-induced alteration of microenvironmental pH. Novartis Found Symp. 2001;240:85–96. - PubMed
    1. Gatenby RA, Gawlinski ET, Gmitro AF, Kaylor B, Gillies RJ. Acid-mediated tumor invasion: a multidisciplinary study. Cancer Res. 2006;66:5216–23. - PubMed

Publication types

MeSH terms