. 2009:2009:385487.
doi: 10.1155/2009/385487. Epub 2009 Jan 4.

Climate change and malaria in Canada: a systems approach

Affiliations

Climate change and malaria in Canada: a systems approach

L Berrang-Ford et al. Interdiscip Perspect Infect Dis. 2009.

Abstract

This article examines the potential for changes in imported and autochthonous malaria incidence in Canada as a consequence of climate change. Drawing on a systems framework, we qualitatively characterize and assess the potential direct and indirect impact of climate change on malaria in Canada within the context of other concurrent ecological and social trends. Competent malaria vectors currently exist in southern Canada, including within this range several major urban centres, and conditions here have historically supported endemic malaria transmission. Climate change will increase the occurrence of temperature conditions suitable for malaria transmission in Canada, which, combined with trends in international travel, immigration, drug resistance, and inexperience in both clinical and laboratory diagnosis, may increase malaria incidence in Canada and permit sporadic autochthonous cases. This conclusion challenges the general assumption of negligible malaria risk in Canada with climate change.


Figures

Figure 1
Figure 1
Annual incidence of malaria (caused by all Plasmodium species) in Canada. Data obtained from the Public Health Agency of Canada [29].
Figure 2
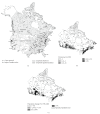
Figure 2
Geographic distribution of vectors of malaria, cases of local mosquito-borne transmission during the period 1957–2003 Figure 2(a), population density Figure 2(b), and population change Figure 2(c) in Canada. (a) shows the geographic distribution of vectors of malaria and cases of local mosquito-borne transmission during the period 1957–2003. Black dots represent location of cases of malaria in the United States and Canada presumed to be acquired from local mosquito-borne transmission between 1957 and 2003 (Source: [, –45]. Each dot represents one or a cluster of cases in a given year. Labels include species type (V = P. vivax, F = P. falciparum, M = P. malariae, S = species unknown) and date. Locations are approximate. Hashed areas represent the approximate distributions of the two most important competent malaria vectors in Canada. (Sources of malaria data: [, –34]). See Table 2 for full names of Canadian provinces. (b) and (c): population density (2001) and population change (1996–2001) in Canada. Source: Population Ecumene Census 2001, GeoGratis, Natural Resources Canada.
Figure 3
Figure 3
(a) Annual number of consecutive days ≥18°C, Toronto. Bars indicate the number of consecutive days per year that temperatures ≥18°C. A trendline (solid line) shows the 10-year moving average for the data. The trendline suggests that in the last few years, we have begun to experience sufficiently prolonged summer warm periods to support parasite replication and malaria transmission potential. In 2002 and 2005, the number of days above 18°C was sufficient to support 2 cycles of P. vivax replication. These data should be considered conservative since each degree-day ≥18°C will reduce the remaining time required for parasite replication. Additionally, breaks in consecutive warm days ≥18°C do not necessarily prohibit continued development once temperatures rise [35]. Source of climate data: Environment Canada [46]. (b) Annual number of consecutive days ≥18°C projected for 2010–2099, Chatham (ON). Bars indicate the number of consecutive days per year that temperatures are projected to reach or exceed 18°C. Error bars indicate the range of values during each time period. The climate change projections were obtained from interpolation (for Chatham, Ontario) of output from the CGCM2 (Canadian Coupled Global Climate Model 2) [47] that were downscaled using LARS-WG stochastic weather generator. LARS-WG was calibrated with 30 years of daily weather observations at Chatham (and its predecessors) obtained from the Environment Canada database. The output used here was obtained using emissions scenario A2 (business as usual). The data and methodology used here are the same as described in Ogden et al. [49]. The projected trend shown here indicates increasingly extended summer warm periods sufficient to support multiple parasite replication cycles.
Figure 4
Figure 4
Malaria life cycle model. The inner model of malaria transmission parameters is based on a diagram and parameters from Smith et al. 2007 [97]. Parameter definitions: R 0 (basic reproductive number) = ma2 bcegn/rg, a (human feeding rate): the number of bites on a human, per mosquito, per day, b (transmission efficiency): the probability that a human becomes infected from a bite by an infectious mosquito, c (transmission efficiency): the probability that a mosquito becomes infected from a bite on an infected human, g (death rate of mosquitoes): expected lifespan of a mosquito in days: 1/g, m: ratio of mosquitoes to humans, n (incubation period): number of days required for the parasite to develop within the mosquito, 1/r: duration of infection in humans.

References

    1. Zucker JR. Changing patterns of autochthonous malaria transmission in the United States: a review of recent outbreaks. Emerging Infectious Diseases. 1996;2(1):37–43. - PMC - PubMed
    1. Parry M, Canziani O, Palutikof J, van der Linden P, Hanson C, editors. Climate Change 2007: Impacts, Adaptation and Vulnerability. Cambridge, UK: Cambridge University Press; 2007. (Working Group II Contribution to the Fourth Assessment Report of the Intergovernmental Panel on Climate Change).
    1. McMichael AJ, Campbell-Lendrum DH, Corvalán CF, et al., editors. Climate Change and Human Health: Risks and Responses. Geneva, Switzerland: World Health Organization; 2003.
    1. McMichael A, Campbell-Lendrum DH, Kovats RS, et al. Climate change. In: Ezzati M, Lopez A, Rodgers A, Vander Hoorn S, Murray C, editors. Comparative Quantification of Health Risks: Global and Regional Burden of Disease Due to Selected Major Risk Factors. Geneva, Switzerland: World Health Organization; 2004. pp. 1543–1649.
    1. McMichael AJ, Woodruff RE, Hales S. Climate change and human health: present and future risks. The Lancet. 2006;367(9513):859–869. - PubMed

LinkOut - more resources