

Clickstream data yields high-resolution maps of science
- PMID: 19277205
- PMCID: PMC2652715
- DOI: 10.1371/journal.pone.0004803
Clickstream data yields high-resolution maps of science
Abstract
Background: Intricate maps of science have been created from citation data to visualize the structure of scientific activity. However, most scientific publications are now accessed online. Scholarly web portals record detailed log data at a scale that exceeds the number of all existing citations combined. Such log data is recorded immediately upon publication and keeps track of the sequences of user requests (clickstreams) that are issued by a variety of users across many different domains. Given these advantages of log datasets over citation data, we investigate whether they can produce high-resolution, more current maps of science.
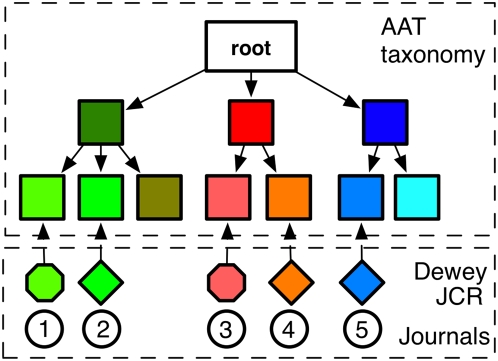
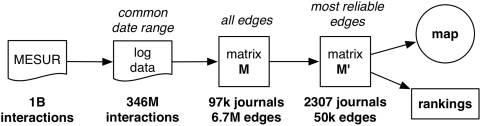
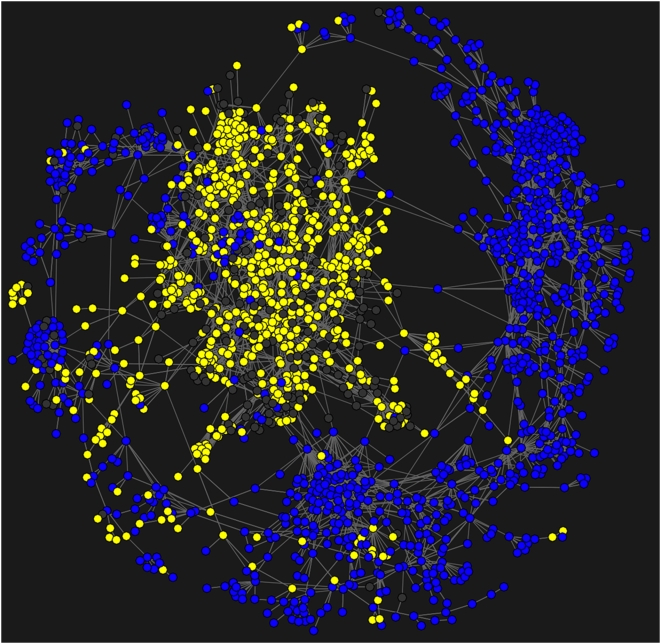
Methodology: Over the course of 2007 and 2008, we collected nearly 1 billion user interactions recorded by the scholarly web portals of some of the most significant publishers, aggregators and institutional consortia. The resulting reference data set covers a significant part of world-wide use of scholarly web portals in 2006, and provides a balanced coverage of the humanities, social sciences, and natural sciences. A journal clickstream model, i.e. a first-order Markov chain, was extracted from the sequences of user interactions in the logs. The clickstream model was validated by comparing it to the Getty Research Institute's Architecture and Art Thesaurus. The resulting model was visualized as a journal network that outlines the relationships between various scientific domains and clarifies the connection of the social sciences and humanities to the natural sciences.
Conclusions: Maps of science resulting from large-scale clickstream data provide a detailed, contemporary view of scientific activity and correct the underrepresentation of the social sciences and humanities that is commonly found in citation data.
Conflict of interest statement
Figures
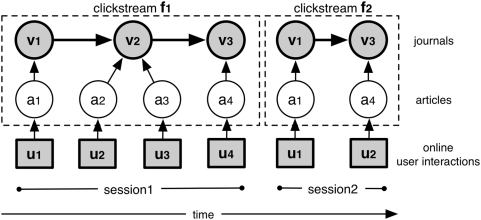
 . Interaction events issued by the same user from the same client can be grouped in user sessions. Each user session represents a clickstream
  that can be expressed as a sequence of the articles that were part of the session's interaction events, i.e.
  . Since every article is published in a journal, we can derive journal clickstreams, i.e.
  . From the collection of all journal clickstreams we can calculate the probability
  .
.
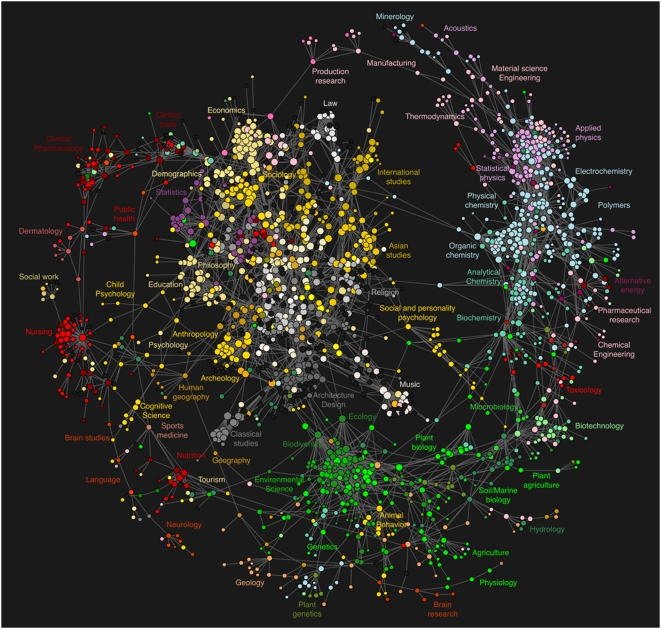
 . Colors correspond to the AAT classification of the journal. Labels have been assigned to local clusters of journals that correspond to particular scientific disciplines.
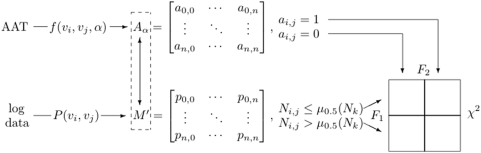
References
-
- Garfield E. Citation indexing for studying science. Nature. 1970;227:669–671. - PubMed
-
- Boyack KW, Wylie BN, Davidson GS. Domain visualization using VxInsight for science and technology management. J Am Soc Inf Sci Technol. 2002;53:764–774.
-
- Boyack KW, Klavans R, Boerner K. Mapping the backbone of science. Scientometrics. 2005;64:351–374.
-
- Leydesdorff L. The generation of aggregated journal-journal citation maps on the basis of the cd-rom version of the science citation index. Scientometrics. 1994;31
-
- de Moya-Anegón F, Vargas-Quesada B, Chinchilla-Rodríguez Z, Corera-Álvarez E, Munoz-Fernández FJ, et al. Visualizing the marrow of science. Journal of the American Society for Information Science and Technology. 2007;58
Publication types
MeSH terms
LinkOut - more resources
Full Text Sources
