. 2009;4(3):e4808.
doi: 10.1371/journal.pone.0004808. Epub 2009 Mar 11.

Microfludic device for creating ionic strength gradients over DNA microarrays for efficient DNA melting studies and assay development

Affiliations

Microfludic device for creating ionic strength gradients over DNA microarrays for efficient DNA melting studies and assay development

Jesper Petersen et al. PLoS One. 2009.

Abstract

The development of DNA microarray assays is hampered by two important aspects: processing of the microarrays is done under a single stringency condition, and characteristics such as melting temperature are difficult to predict for immobilized probes. A technical solution to these limitations is to use a thermal gradient and information from melting curves, for instance to score genotypes. However, application of temperature gradients normally requires complicated equipment, and the size of the arrays that can be investigated is restricted due to heat dissipation. Here we present a simple microfluidic device that creates a gradient comprising zones of defined ionic strength over a glass slide, in which each zone corresponds to a subarray. Using this device, we demonstrated that ionic strength gradients function in a similar fashion as corresponding thermal gradients in assay development. More specifically, we noted that (i) the two stringency modulators generated melting curves that could be compared, (ii) both led to increased assay robustness, and (iii) both were associated with difficulties in genotyping the same mutation. These findings demonstrate that ionic strength stringency buffers can be used instead of thermal gradients. Given the flexibility of design of ionic gradients, these can be created over all types of arrays, and encompass an attractive alternative to temperature gradients, avoiding curtailment of the size or spacing of subarrays on slides associated with temperature gradients.


Conflict of interest statement

Competing Interests: The authors have declared that no competing interests exist.

Figures

Figure 1
Figure 1. The multi-stringency array washer (MSAW).
(A) Schematic drawing of an assembled system viewed from the side. The main parts of the device are shown: (i) the PMMA support; (ii) the PDMS layer, which defines the fluidic channels and the alignment groove for the microscope slide; (iii) the microscope slide printed with identical subarrays that face towards corresponding chambers after the device is sealed. (B) Photograph of the assembled MSAW.
Figure 2
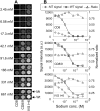
Figure 2. Scanning images of processed arrays and corresponding melting curves.
The images show a subset of hybridized probes washed at different sodium concentrations (A). The target material originated from a person heterozygous for the CD8/9 +G mutation. The sodium concentrations in the respective zones are denoted to the left, and the identities of the probes are indicated below the images. Wild-type probes (Wt) for the different mutations and the corresponding mutant probes (Mt) are shown at the bottom and the top of each panel, respectively. The melting curves corresponding to (A) are presented in (B). The wild-type (square) and the mutant (diamond) signal, along with the normalized ratio between those two signals (triangles; see Materials and Methods), are shown for three different mutation sites (CD8 −AA, CD8/9 +G, and IVS I+6 T>C). The graphs are based on the quantified signal intensity (in arbitrary units, a.u.) of the scanning images obtained at the corresponding sodium concentration. For easier comparison with temperature-based dissociation curves obtained previously , the X-axis are inverted. All calculations are based on four replicates in each stringency zone. Note that the images in (A) have been changed slightly in terms of contrast and brightness for clarity, whereas the graphs are based on raw signals.
Figure 3
Figure 3. Relationship between measured melting temperature (Tm) and the sodium concentration at which half of the initial probe signal remained (Sh).
The experimentally obtained Sh and Tm values (Tm data obtained from reanalyzing the results obtained previously [5]) for each probe pair were plotted against each other, which gave a linear correlation coefficient (R2) of 0.822.
Figure 4
Figure 4. Genotyping of patient material using the MSAW and a Tm-matched probe set.
Thirty-one different samples were individually hybridized to arrays of probes and subsequently processed in the MSAW. For each mutation site, a graph shows the normalized ratios (see Materials and Methods) at the indicated sodium concentrations. The x-axis are inverted to reflect increasing stringency towards the right. Symbols: diamonds, the average value of all samples carrying the wild-type DNA sequence on both alleles (28 samples per mutation, except 26 each for CD5 and CD8/9); error bars, the minimum and maximum observed ratios; dashes, the normalized ratios for heterozygous samples (three samples for each mutation site); triangles, the normalized ratios for homozygous mutations in positions CD5 and CD8/9 (two samples each). The values corresponding to 17.3 mM Na+ are shown in red.
Figure 5
Figure 5. Comparison of different methods of genotyping in the MSAW.
We defined probe pair performance as successful when homozygotes had normalized ratios of >0.7 (wild types) or <0.3 (mutants), and heterozygotes had normalized ratios between 0.35 and 0.65; these limits are indicated by the hatched lines in the graphs. (A) T m-matched probe set in which all probes were washed under the single optimal condition of 17.3 mM sodium. (B) T m-matched probe set in which each probe pair was washed at its individual optimal sodium concentration, so that the normalized ratio of the heterozygotes was as close to 0.5 as possible, and the separation into genetic classes was as good as could be achieved. (C). A mixed set of probe pairs, all of which originated from the Tm-matched probe set, except those specific for positions CD17 and CD24, for which we substituted shorter probes (indicatd by asterisks) (see also Table 1). The ratio shown for each probe pair represents the condition that was optimal for clear classification of genotypes, which is indicated by the values given below each mutation. Computation of normalized ratios is explained in the Materials and Methods section, and the symbols used are described in the legend of Figure 4.
Figure 6
Figure 6. Tm and ΔG calculated over the beta-globin gene fragment.
The graphs are based on the nearest neighbor thermodynamic model for RNA/DNA duplexes, suggested by Sugimoto et al. . In this model, each point was initially calculated as the midpoint of a 17-nucleotide window and was subsequently represented as a moving average of five such windows. The graphs illustrate the calculated Tm (°C) values (top) and ΔG (kcal/mol) values (bottom). The mutation sites investigated in the present study are noted in the graphs.

References

    1. Vainrub A, Pettitt BM. Surface electrostatic effects in oligonucleotide microarrays: control and optimization of binding thermodynamics. Biopolymers. 2003;68:265–270. - PubMed
    1. Zhang L, Wu C, Carta R, Zhao H. Free energy of DNA duplex formation on short oligonucleotide microarrays. Nucleic Acids Res. 2007;35:e18. - PMC - PubMed
    1. Marcy Y, Cousin PY, Rattier M, Cerovic G, Escalier G, et al. Innovative integrated system for real-time measurement of hybridization and melting on standard format microarrays. Biotechniques. 2008;44:913–920. - PubMed
    1. Stromqvist ML, Hopkins K, Liebana E, Brookes AJ. DNA diagnostics by surface-bound melt-curve reactions. J Mol Diagn. 2007;9:30–41. - PMC - PubMed
    1. Petersen J, poulsen L, Petronis S, Birgens H, Dufva M. Use of a multi-thermal washer for DNA microarrays simplifies probe design and gives robust genotyping assays. Nucleic Acids Res. 2008;36:e10. - PMC - PubMed

Publication types