

Symmetry between the right and left eyes of the normal retinal nerve fiber layer measured with optical coherence tomography (an AOS thesis)
- PMID: 19277241
- PMCID: PMC2646446
Symmetry between the right and left eyes of the normal retinal nerve fiber layer measured with optical coherence tomography (an AOS thesis)
Abstract
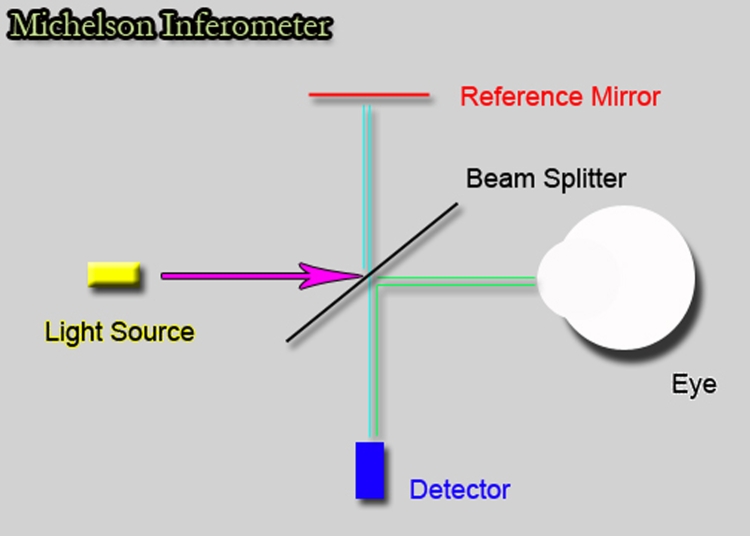
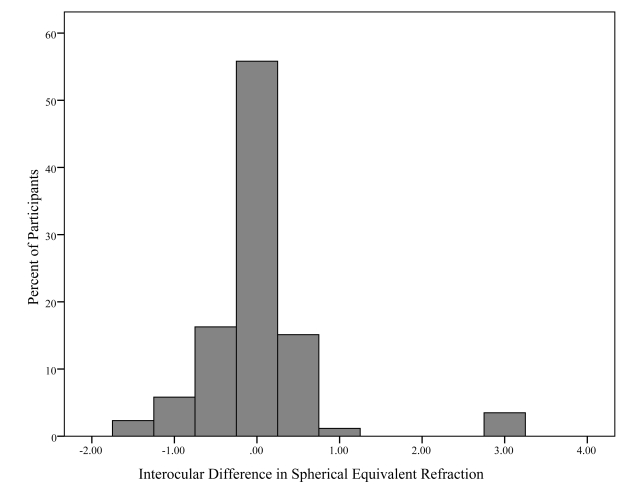
Purpose: To determine the limits of the normal amount of interocular symmetry in retinal nerve fiber layer (RNFL) thickness measurements obtained with third-generation time domain optical coherence tomography (OCT3).
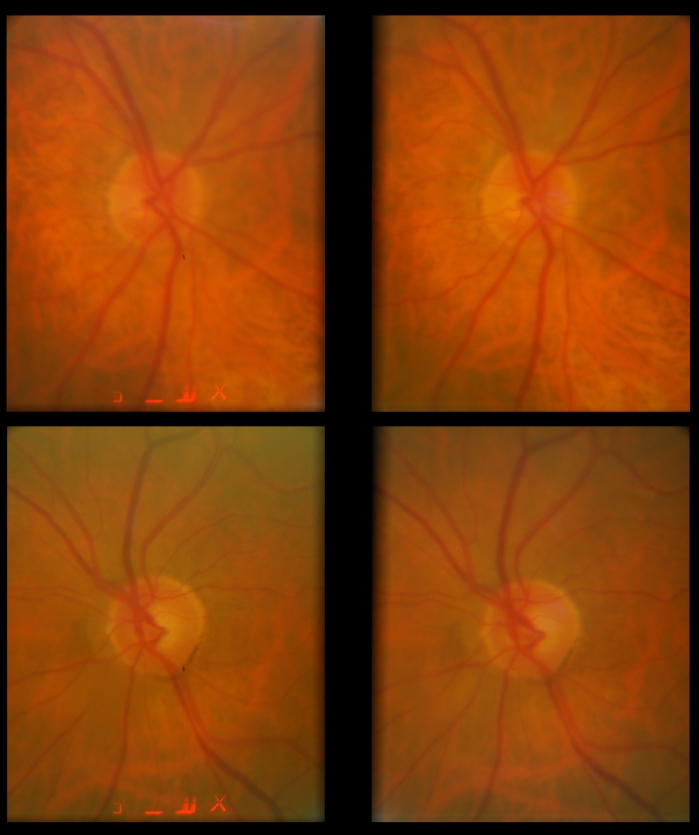
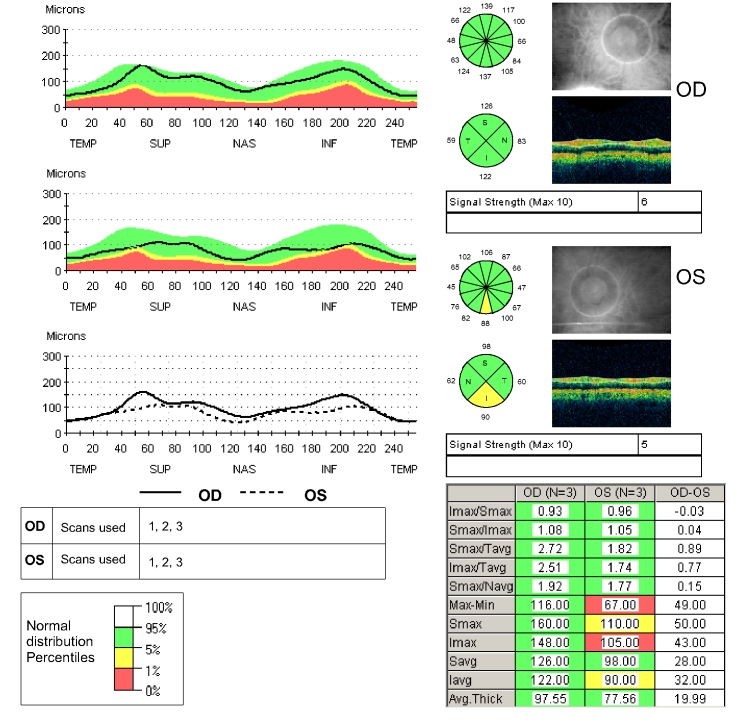
Methods: Both eyes of normal volunteers were scanned using the peripapillary standard and fast RNFL algorithms of OCT3.
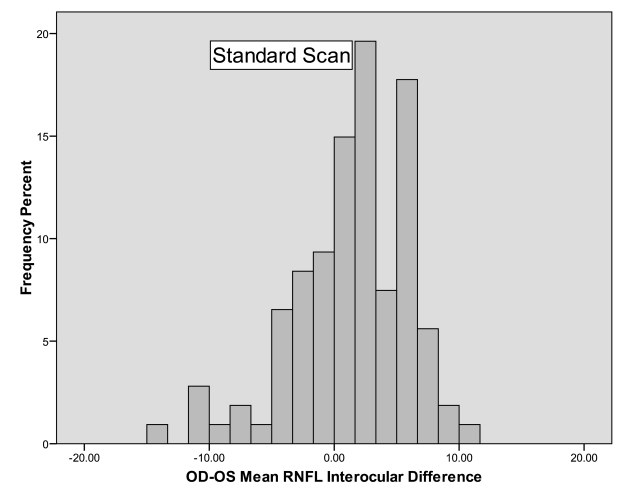
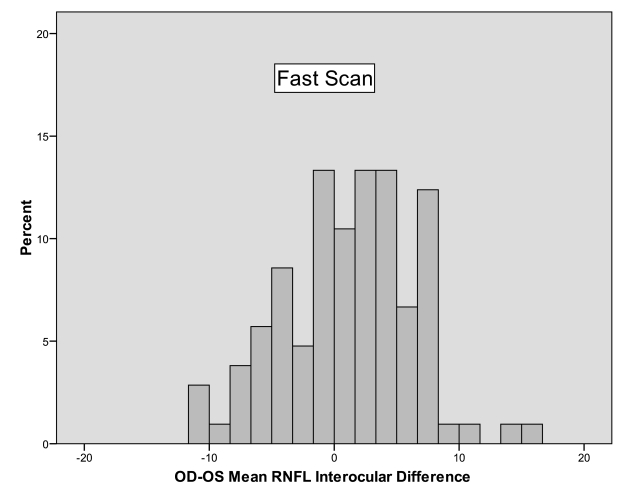
Results: A total of 108 volunteers were included in the analysis. The mean +/- standard deviation (SD) of age of the volunteers was 46.0 +/- 15.0 years (range 20-82). Forty-two participants (39%) were male and 66 (61%) were female. Mean RNFL thickness correlated extremely well, with intraclass correlation coefficients of 0.89 for both algorithms (95% confidence interval [CI], 0.84-0.93). The mean RNFL thickness of the right eye measured 1.3 mum thicker than the left on the standard scan (SD 4.7, 95% CI 0.4-2.2, P = .004) and 1.2 mum on the fast scan (SD 5.2, 95% CI 0.1-2.2, P = .026). The 95% tolerance limits on the difference between the mean RNFL thicknesses of right minus left eye was -10.8 and +8.9 mum with the standard scan algorithm and -10.6 and +11.7 mum with the fast scan algorithm.
Conclusions: Mean RNFL thickness between the 2 eyes of normal individuals should not differ by more than approximately 9 to 12 mum, depending on which scanning algorithm of OCT3 is used and which eye measures thicker. Differences beyond this level suggest statistically abnormal asymmetry, which may represent early glaucomatous optic neuropathy.
Figures
Similar articles
-
Spectral domain optical coherence tomography for glaucoma (an AOS thesis).Trans Am Ophthalmol Soc. 2008;106:426-58. Trans Am Ophthalmol Soc. 2008. PMID: 19277249 Free PMC article.
-
Diagnostic capability of optical coherence tomography in evaluating the degree of glaucomatous retinal nerve fiber damage.Invest Ophthalmol Vis Sci. 2006 May;47(5):2006-10. doi: 10.1167/iovs.05-1102. Invest Ophthalmol Vis Sci. 2006. PMID: 16639009
-
Reproducibility of spectral-domain optical coherence tomography RNFL map for glaucomatous and fellow normal eyes in unilateral glaucoma.J Glaucoma. 2015 Mar;24(3):238-44. doi: 10.1097/IJG.0000000000000143. J Glaucoma. 2015. PMID: 25350817
-
Reproducibility of retinal nerve fiber layer thickness measurements using the eye tracker and the retest function of Spectralis SD-OCT in glaucomatous and healthy control eyes.Invest Ophthalmol Vis Sci. 2011 May 18;52(6):3338-44. doi: 10.1167/iovs.10-6611. Invest Ophthalmol Vis Sci. 2011. PMID: 21330656
-
Peripapillary Retinal Nerve Fiber Layer Vascular Microcirculation in Eyes With Glaucoma and Single-Hemifield Visual Field Loss.JAMA Ophthalmol. 2017 May 1;135(5):461-468. doi: 10.1001/jamaophthalmol.2017.0261. JAMA Ophthalmol. 2017. PMID: 28358939 Free PMC article.
Cited by
-
Do biometric parameters improve the quality of optic nerve head measurements with spectral domain optical coherence tomography?BMC Ophthalmol. 2022 Feb 5;22(1):56. doi: 10.1186/s12886-022-02281-6. BMC Ophthalmol. 2022. PMID: 35123423 Free PMC article.
-
Interocular retinal nerve fiber layer thickness difference in normal adults.PLoS One. 2015 Feb 13;10(2):e0116313. doi: 10.1371/journal.pone.0116313. eCollection 2015. PLoS One. 2015. PMID: 25679786 Free PMC article.
-
Birth Weight Is a Significant Predictor of Retinal Nerve Fiber Layer Thickness at 36 Weeks Postmenstrual Age in Preterm Infants.Am J Ophthalmol. 2021 Feb;222:41-53. doi: 10.1016/j.ajo.2020.08.043. Epub 2020 Sep 4. Am J Ophthalmol. 2021. PMID: 32891695 Free PMC article.
-
Ocular dominance and its association with retinal thickness profile - A cross-sectional study.Indian J Ophthalmol. 2024 Aug 1;72(8):1181-1185. doi: 10.4103/IJO.IJO_203_24. Epub 2024 Jul 29. Indian J Ophthalmol. 2024. PMID: 39078963 Free PMC article.
-
Comparison of ganglion cell-inner plexiform layer thickness among patients with intermittent exotropia according to fixation preference: a retrospective observational study.J Yeungnam Med Sci. 2025;42:6. doi: 10.12701/jyms.2024.00864. Epub 2024 Oct 25. J Yeungnam Med Sci. 2025. PMID: 39463153 Free PMC article.
References
-
- Quigley HA, Dunkelberger GR, Green WR. Retinal ganglion cell atrophy correlated with automated perimetry in human eyes with glaucoma. Am J Ophthalmol. 1989;107:453–464. - PubMed
-
- Mikelberg FS, Yidegiligne HM, Schulzer M. Optic nerve axon count and axon diameter in patients with ocular hypertension and normal visual fields. Ophthalmology. 1995;102:342–348. - PubMed
-
- Kerrigan-Baumrind LA, Quigley HA, Pease ME, Kerrigan DF, Mitchell RS. Number of ganglion cells in glaucoma eyes compared with threshold visual field tests in the same persons. Invest Ophthalmol Vis Sci. 2000;41:741–748. - PubMed
-
- Pederson JE, Anderson DR. The mode of progressive optic disc cupping in ocular hypertension and glaucoma. Arch Ophthalmol. 1980;98:490–495. - PubMed
Publication types
MeSH terms
Grants and funding
LinkOut - more resources
Full Text Sources
Other Literature Sources
Medical
