. 2008:106:357-82.

Higher irradiance and photodynamic therapy for age-related macular degeneration (an AOS thesis)

Affiliations

Higher irradiance and photodynamic therapy for age-related macular degeneration (an AOS thesis)

Joan W Miller. Trans Am Ophthalmol Soc. 2008.

Abstract

Purpose: Photodynamic therapy (PDT) using verteporfin was the first pharmacologic therapy for neovascular age-related macular degeneration and changed the treatment paradigm for a major, blinding disease. The experimental work in the nonhuman primate was essential in developing treatment parameters for verteporfin PDT that could successfully occlude choroidal neovascularization with limited injury to the neural retina. Early in the preclinical primate studies, we hypothesized that higher irradiances could be used for ocular PDT than had been used in dermatology and other applications, which typically utilized an irradiance of 150 to 200 mW/cm(2). We set out to test the feasibility of irradiances up to 1800 mW/cm(2).

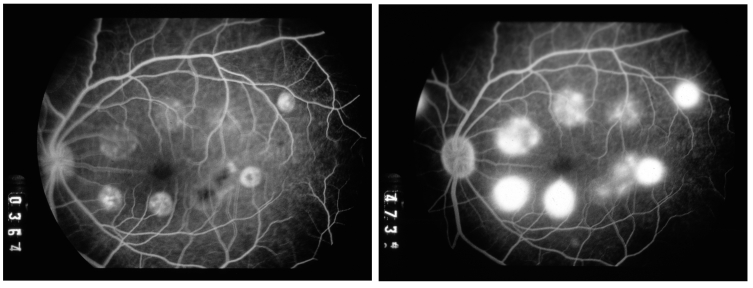
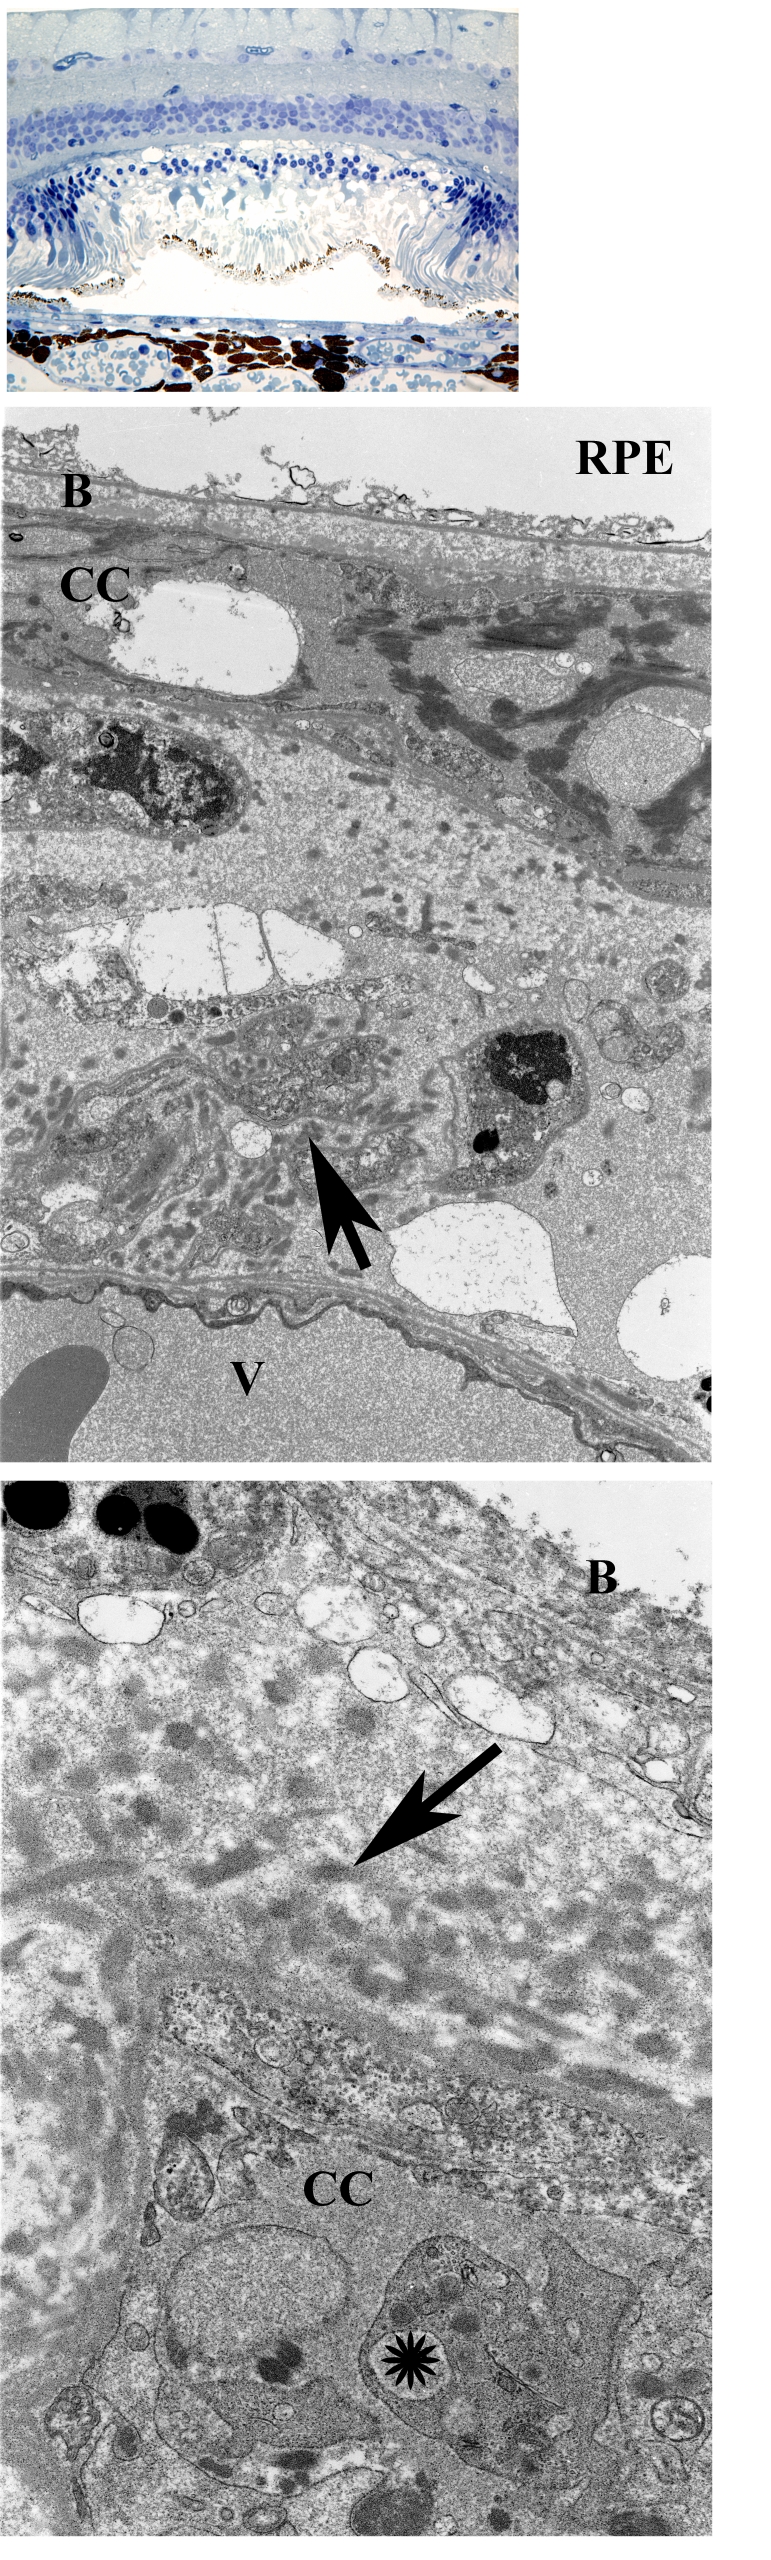
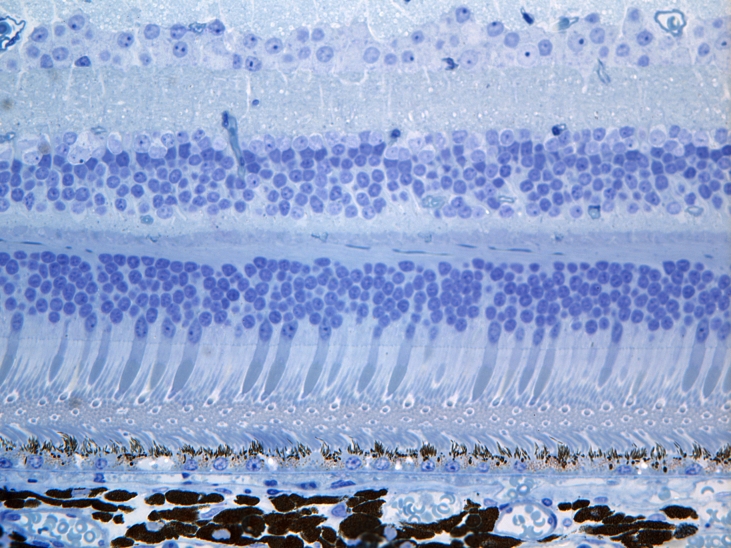
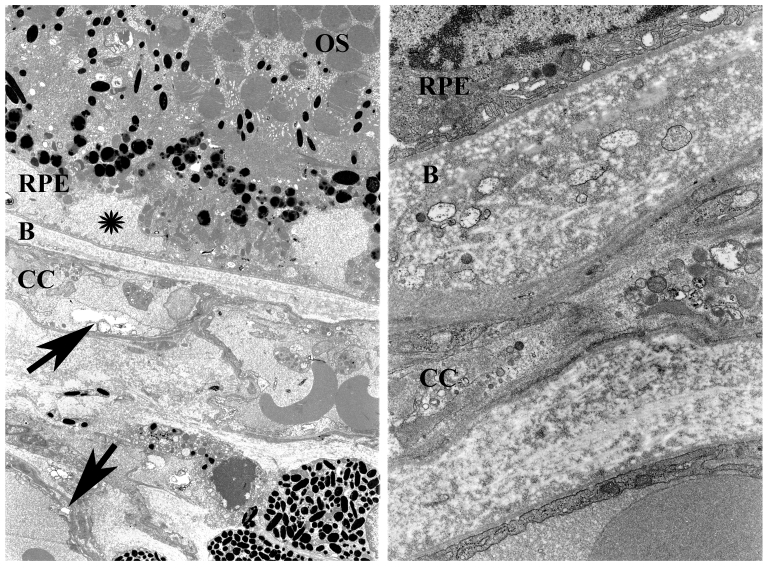
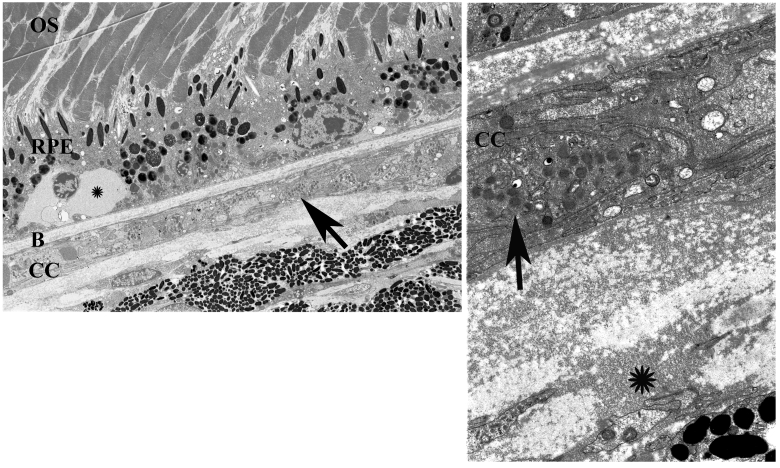
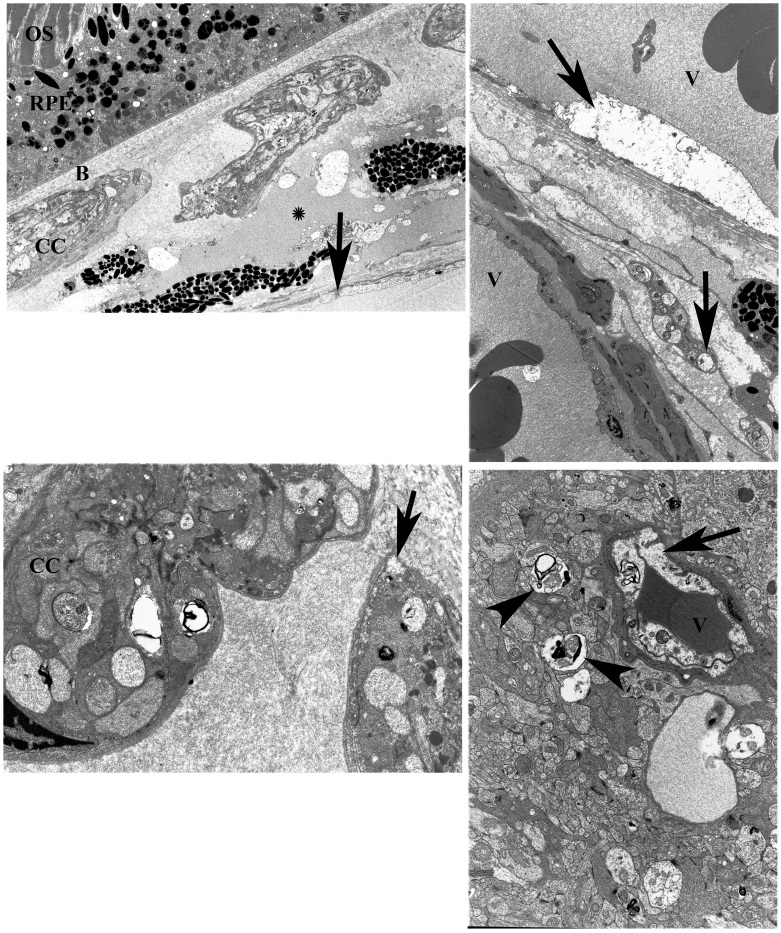
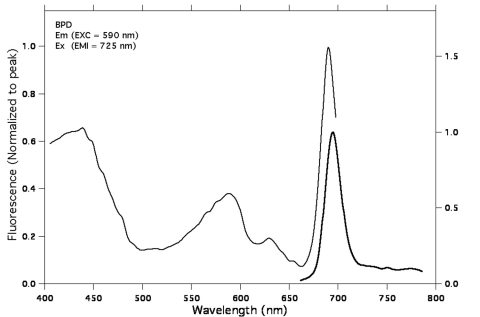
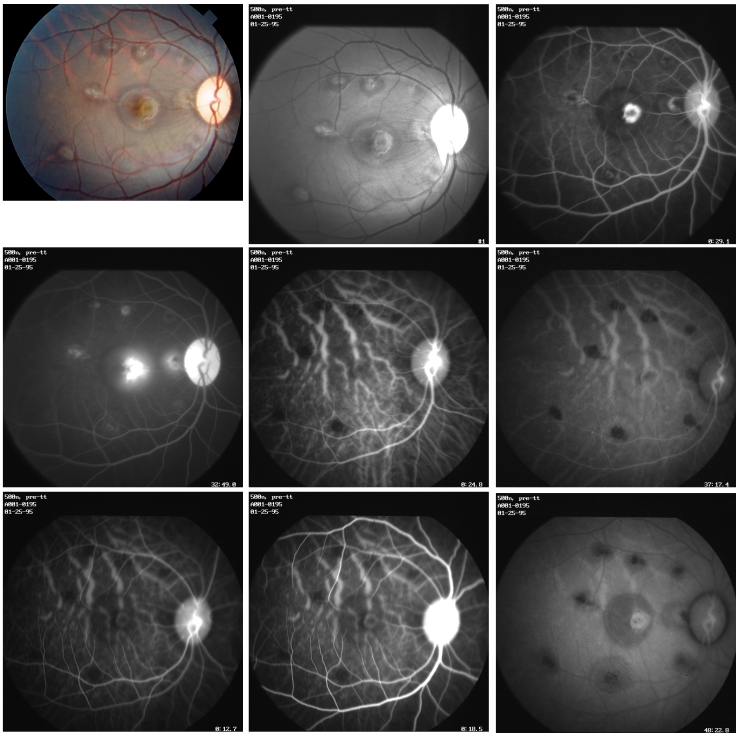
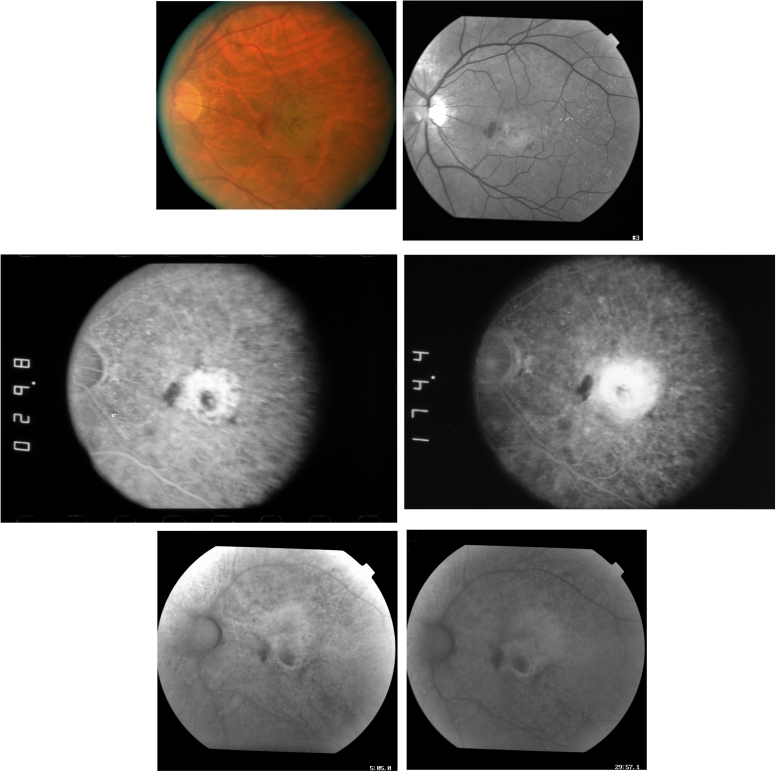
Methods: PDT was applied to normal monkey eyes using verteporfin/benzoporphyrin derivative (BPD) (2 mg/kg) mixed with low-density lipoprotein in DMSO, and 692-nm light, with a spot size 1250mum, fluence approximately 50 J/cm(2), and irradiance varying from 150 (treatment time, 6 minutes) to 1800 mW/cm(2) (treatment time, 30 seconds). Photocoagulation lesions were applied using 514-nm and 692-nm laser light without drug, with irradiance of 18,750 to 200,000 mW/cm(2) and spot size of 500 mum. Treatment effect was evaluated by fundus photography, angiography, and light and electron microscopy with collagen denaturation as a marker of thermal injury.

Results: Verteporfin/BPD PDT at irradiances of 150 to 1800 mW/cm(2) showed no collagen denaturation in contrast to photocoagulation lesions without dye (irradiance 10-fold and higher).

Conclusions: Verteporfin PDT could safely be performed at higher irradiances, permitting a clinically practical therapy. Ultimately, clinical trials demonstrated that verteporfin PDT could limit moderate vision loss in neovascular age-related macular degeneration. Although anti-VEGF therapy has replaced PDT as a first-line therapy, PDT may still have a role, perhaps in combination therapies. Further investigations to optimize drug delivery and to better understand the molecular mechanisms of PDT effects in both choroidal neovascularization and retina will improve its application in macular diseases.


Figures

FIGURE 1
FIGURE 1
The Jablonski diagram. The thick horizontal lines indicate electronic energy levels. S0, S1, and S2 are singlet electronic energy levels of the photosensitizer (PS); T1 and T2 are triplet electronic energy levels. The thin horizontal lines represent the vibrational energy levels associated with each electronic state. The blue arrow represents light absorption of a blue (energized) photon. The red upward-pointing arrow represents red (less energetic) light absorption. The red (down-pointing) arrows represent fluorescence (ie, loss of energy) at 2 different wavelengths. The horizontal arrows labeled ISC (intersystem crossing) represent radiationless processes in which the PS goes from a singlet to triplet electronic state or vice versa. This process is generally fast relative to vibrational energy loss by energy exchange with the surrounding molecules. The latter, indicated by VR (vibrational relaxation), are also radiationless processes and indicate energy loss by the PS in the form of heat to the surroundings. The arrows labeled with IC (internal conversion) represent a change in an electronic state (between 2 singlet or 2 triplet states), which is generally followed by vibrational energy. This is followed by vibrational relaxation of the PS molecule and the corresponding heating of the environment. Finally, the dashed red vertical arrows represent a low-probability energy loss process of the PS by emitting phosphorescent photons in the infrared. This is accompanied by a change from the T1 electronic state to the S0 ground state. (Reprinted with permission from van den Bergh HE et al.12)
FIGURE 2
FIGURE 2
Absorption spectra of selected photosensitizers that have been used in photodynamic therapy. PF, photofrin; BPD-MA, benzoporphyrin derivative monoacid; Ce6, chlorin e6; CASPc, chloroaluminum sulfonated phthalmocyanine. (Reprinted with permission from Lui H et al.84)
FIGURE 3
FIGURE 3
Left, Color fundus photograph after laser irradiation. Lesions show varying tissue effect from no apparent change to mild outer retinal whitening, to intense retinal whitening with subretinal fluid. Right, Schematic diagram indicating the laser lesions. For ease of correlation, the shape drawn matches the shape seen in the late frame of the fluorescein shown in Figure 4, right. Nasal lesions are indicated, although they are not captured in the angiogram frames, and only 2 of 3 are seen in the color fundus photograph. The treatment parameters are shown in Table 4.
FIGURE 3
FIGURE 3
Left, Color fundus photograph after laser irradiation. Lesions show varying tissue effect from no apparent change to mild outer retinal whitening, to intense retinal whitening with subretinal fluid. Right, Schematic diagram indicating the laser lesions. For ease of correlation, the shape drawn matches the shape seen in the late frame of the fluorescein shown in Figure 4, right. Nasal lesions are indicated, although they are not captured in the angiogram frames, and only 2 of 3 are seen in the color fundus photograph. The treatment parameters are shown in Table 4.
FIGURE 4
FIGURE 4
Fundus fluorescein angiogram during transit (left) and late in the angiogram (right) showing early hypofluorescence with late staining and leakage.
FIGURE 5
FIGURE 5
Top, After irradiation with 37,500 mW/cm2 irradiance (lesion I, 692 nm with no dye), the outer retina is completely destroyed with no surviving receptor cells or retinal pigment epithelium (RPE) cells. Choriocapillaris shows evidence of thrombosis while larger choroidal vessels remain open. Denatured collagen is present but not visible at this magnification (toluidine blue, original magnification ×40). Middle, After irradiation at 37,500 mW/cm2, the choroid below Bruch’s membrane (B) shows the choriocapillaris (CC) closed, endothelium damaged, and fibrin present within the capillary. The retinal pigment epithelium above (RPE) is destroyed. Between the choriocapillaris and a larger vessel below (V) are damaged cells, large vacuoles, debris, plasma infiltrate, and fibrils of denatured collagen (arrow) (uranyl acetate and Sato’s lead stain, original magnification ×3900). Bottom, Higher magnification of the area of lesion I shows fibrils of denatured collagen (arrow) around a choriocapillaris (CC) closed by platelets (asterisk) (uranyl acetate and Sato’s lead stain, original magnification ×11,500). B, Bruch’s membrane.
FIGURE 6
FIGURE 6
Retina appears normal in lesion L after irradiation with 1200 mW/cm2 irradiance except for vacuolation of the retinal pigment epithelium (RPE) and platelet thrombi found in some choriocapillaris vessels. Rare pyknotic outer nuclear layer nuclei were seen and all larger choroidal vessels were patent (toluidine blue, original magnification ×40).
FIGURE 7
FIGURE 7
Left, In lesion M, an area of retina irradiated with 600 mW/cm2 irradiance, the retinal pigment epithelium (RPE) appears damaged with large extracellular pools of electron dense material (asterisk) present. The choriocapillaris (CC) shows damage to the endothelium (arrow) and platelets in the lumen, and a larger vessel below shows vacuolation of the endothelium (arrow). The matrix appears edematous and a dying cell is seen, but no evidence of denatured collagen is noted. Outer segment (OS) profiles above the RPE appear infrequently damaged (uranyl acetate and Sato’s lead stain, original magnification ×2200). Bruch’s membrane (B). Right, Higher magnification of lesion M shows a surviving RPE cell (RPE) with vacuoles and a loss of basal infoldings, platelet-filled choriocapillaris (CC), and normal endothelium on a larger vessel below. There is increased edematous opacity to the matrix and some debris in Bruch’s membrane (B) but no denatured collagen (uranyl acetate and Sato’s lead stain, original magnification ×8900).
FIGURE 8
FIGURE 8
Left, Irradiation with 1200 mW in lesion L produces closure of the choriocapillaris (CC) with platelet thrombus (arrow), some damage to the retinal pigment epithelium (RPE) including cytoplasmic condensation and vacuolation (asterisk), and little change to the outer segments (OS). The matrix has some infiltrate, matrix cells show minimal changes, and there is no evidence of denatured collagen (uranyl acetate and Sato’s lead stain, original magnification = ×1650). Bruch’s membrane (B). Right, Higher magnification of the 1200-mW/cm2 spot at lesion L shows the choriocapillaris (CC) closed by platelet thrombus (arrow), plasma infiltrate in the matrix (asterisk), and no evidence of denatured collagen. (uranyl acetate and Sato’s lead stain, original magnification ×8900).
FIGURE 9
FIGURE 9
Top left, In lesion K, the area of retina irradiated with 1800mW/cm2 with dye, outer segments (OS) appear normal, while the RPE (RPE) shows some vacuolation and loss of basal infoldings. The choriocapillaris (CC) is closed by platelet thrombus. The matrix shows plasma infiltration (asterisk) and damaged cells with debris. A larger vessel at the bottom shows endothelial disruption (arrow). No evidence of collagen denaturation. (uranyl acetate and Sato’s lead stain, original magnification ×2200). Bruch’s membrane (B). Top right, In lesion K, deeper choroidal vessels (V) show damage to the endothelium (arrow) and vacuolation to matrix cells (arrow), but no denatured collagen is seen (uranyl acetate and Sato’s lead stain, original magnification ×2950). Lower left, Higher magnification of lesion K shows closure of two choriocapillaries (CC) by platelets and fibrin with endothelial damage (arrow). The matrix shows normal collagen. (uranyl acetate and Sato’s lead stain, original magnification ×6610). Lower right, Retinal vessels are affected at 1800 mW/cm2 irradiance. This capillary (V) in lesion K shows damaged endothelium (arrow) and some of the surrounding nerve fibers are also affected (arrowheads) (uranyl acetate and Sato’s lead stain, original magnification ×5200).
FIGURE 10
FIGURE 10
Absorption and fluorescence spectra for benzoporphyrin derivative (BPD).
FIGURE 11
FIGURE 11
Benzoporphyrin derivative (BPD) angiography of experimental choroidal neovascularization (CNV). Fundus photography and angiography of experimental CNV in the nonhuman primate. Color image (top left) and red-free (top middle) photographs show pigment change in several areas corresponding to the laser injury sites and subsequent CNV. In the subfoveal region there is pigmented subfoveal tissue with elevation from subretinal fluid. Fluorescein angiography shows early hyperfluorescence (top right) at 29 seconds with late leakage (middle left) at 32 minutes from subfoveal CNV. Leakage from other areas of CNV are also apparent. Indocyanine green (ICG) angiography shows large choroidal vessels and retinal vessels; in the subfoveal area there is a web of early hyperfluorescence (middle center) at 24.8 seconds suggesting CNV, but without hot spots or plaques noted in the late frames (middle right) at 37 minutes. BPD angiography shows small choroidal vessels, retinal vessels, and early hyperfluorescence in the area of subfoveal CNV as early as 12 seconds (lower left) with clearer delineation of subfoveal CNV as a hyperfluorescent net (lower middle) at 18 seconds with persistent hyperfluorescence in CNV in later frames (lower right) at 48 minutes without leakage. Surrounding the CNV is a circular area of hypofluorescence corresponding to the area of subretinal fluid. BPD is no longer visible in most of the choroidal vessels or in the retinal vessels. (Reprinted with permission from Husain D et al.94)
FIGURE 12
FIGURE 12
Benzoporphyrin derivative (BPD) angiography in patients with subfoveal choroidal neovascularization (CNV). Color (top left) and red-free (top right) photographs demonstrate subretinal tissue, hemorrhage, and fluid. Fluorescein angiography shows early hyperfluorescence (middle left) and late leakage (middle right) consistent with classic CNV. BPD angiography shows hyperfluorescence corresponding to the subretinal tissue at 5 minutes (lower left) with some fluorescence noted in retinal vessels overlying the disc; the hyperfluorescence of the subretinal tissue persists at 37 minutes (lower right).

Similar articles

Cited by

References

    1. Nanda S, Hatchell D, Tiedeman J, Dutton J, Hatchell M, McAdoo T. A new method of vascular occlusion. Photochemical initiation of thrombosis. Arch Ophthalmol. 1987;105:1121–1124. - PubMed
    1. Miller JW, Stinson WG, Gregory WA, El-Khoumy HA, Puliafito CA. Phthalocyanine photodynamic therapy of experimental iris neovascularization. Ophthalmology. 1991;98:1711–1719. - PubMed
    1. Kliman G, Puliafito C, Stern D, Borirakchanyavat S, Gregory W. Phthaloycyanine photodynamic therapy: new strategy for closure of choroidal neovascularization. Lasers Surg Med. 1994;15:2–10. - PubMed
    1. Kliman G, Puliafito C, Grossman G, Gregory W. Retinal and choroidal vessel closure using phthalocyanine photodynamic therapy. Lasers Surg Med. 1994;15:11–18. - PubMed
    1. Miller H, Miller B. Photodynamic therapy of subretinal neovascularization in the monkey eye. Arch Ophthalmol. 1993;111:855–860. - PubMed

Publication types

MeSH terms