. 2008:106:383-401.

The Minnesota Grading System using fundus autofluorescence of eye bank eyes: a correlation to age-related macular degeneration (an AOS thesis)

Affiliations

The Minnesota Grading System using fundus autofluorescence of eye bank eyes: a correlation to age-related macular degeneration (an AOS thesis)

Timothy W Olsen. Trans Am Ophthalmol Soc. 2008.

Abstract

Purpose: To establish a grading system of eye bank eyes using fundus autofluorescence (FAF) and identify a methodology that correlates FAF to age-related macular degeneration (AMD) with clinical correlation to the Age-Related Eye Disease Study (AREDS).

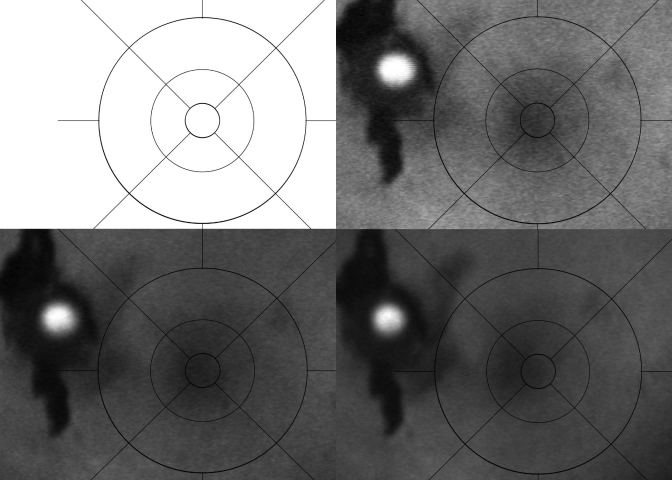
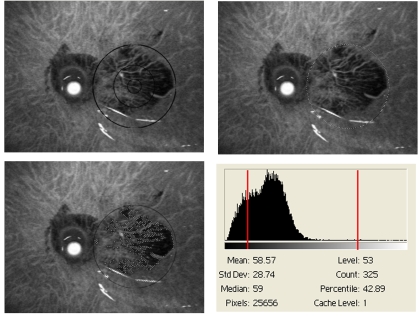
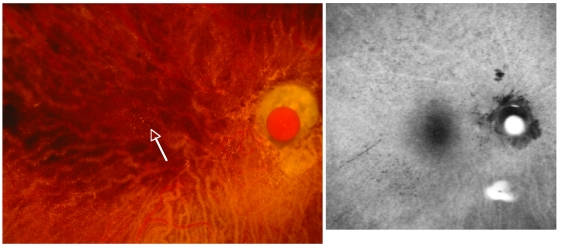
Methods: Two hundred sixty-two eye bank eyes were evaluated using a standardized analysis of FAF. Measurements were taken with the confocal scanning laser ophthalmoscope (cSLO). First, high-resolution, digital, stereoscopic, color images were obtained and graded according to AREDS criteria. With the neurosensory retina removed, mean FAF values were obtained from cSLO images using software analysis that excludes areas of atrophy and other artifact, generating an FAF value from a grading template. Age and AMD grade were compared to FAF values. An internal fluorescence reference standard was tested.

Results: Standardization of the cSLO machine demonstrated that reliable data could be acquired after a 1-hour warm-up. Images obtained prior to 1 hour had falsely elevated levels of FAF. In this initial analysis, there was no statistical correlation of age to mean FAF. There was a statistically significant decrease in FAF from AREDS grade 1, 2 to 3, 4 (P < .0001). An internal fluorescent standard may serve as a quantitative reference.

Conclusions: The Minnesota Grading System (MGS) of FAF (MGS-FAF) establishes a standardized methodology for grading eye bank tissue to quantify FAF compounds in the retinal pigment epithelium and correlate these findings to the AREDS. Future studies could then correlate specific FAF to the aging process, histopathology AMD phenotypes, and other maculopathies, as well as to analyze the biochemistry of autofluorescent fluorophores.


Figures

FIGURE 1
FIGURE 1
Standardization curve for fundus autofluorescence (AF) vs time. The AF of the confocal scanning laser ophthalmoscope (cSLO) is compared to 140 minutes time from start-up. The data points (± standard deviation) were based on standard change in mean AF image intensity from baseline, taken on the same globes at the specified time intervals. Note how the AF intensity is extremely high at the initial start-up of the cSLO and slowly decreases over time. By 1 hour, the curve flattens and the subsequent measurements become more reproducible. The AF scale is in arbitrary units and represents the change in fluorescence density; therefore, numbers are negative when the images become less fluorescent.
FIGURE 2
FIGURE 2
Fundus autofluorescence (FAF) images taken at various times within the first hour after start-up of the confocal scanning laser ophthalmoscope (cSLO), demonstrating the changes in “apparent” FAF over time on the same specimen. Upper left, Image taken upon start-up shows a bright white washout that makes analysis impossible. Upper right, Image taken at 20 minutes demonstrates a bright but discernable FAF image of the left macular region. The grading template (dark circular lines) and the ruby sphere (bright white circle) are easily visible. Lower left, Image of the same globe taken at 40 minutes with less “apparent” FAF. Lower right, Image taken at approximately 1 hour shows no change in “apparent” FAF at later times.
FIGURE 3
FIGURE 3
Digital color and fundus autofluorescence (FAF) image overlays, demonstrating the transitional overlay of the color fundus image to the FAF image that ensures accurate size and orientation analysis (especially relative to the macula). Upper left, Color image is dominant over the FAF image and has peripapillary irregularities (outside of the grading circle) and a visible ruby sphere on the optic nerve. Upper right, Gradual fading of the color image, with a more prominent view of the FAF image and the dark black–appearing peripapillary artifact. The ruby sphere is easily recognized for size reference (matches the 1000-μm center ring of the macular grading template). Bottom left, Faded color image over the dominant FAF image is seen, as well as the correspondence of the macular region and the peripapillary artifact for orientation. Bottom right, Removal of the color image, with the grading rings oriented properly for size and centered directly on the macula.
FIGURE 4
FIGURE 4
Digital image representation used to calculate mean autofluorescence. Three images and a histogram demonstrate the computerized analysis of the FAF image using a program that eliminates dark areas of geographic atrophy (GA) and artifactual white light reflexes from analysis. Upper left, FAF image of an eye with advanced age-related macular degeneration represented by central GA (dark area). Upper right, Computer-generated circumference ring of 6000 μm, generated in reference to the grading template. Bottom right, Resultant histogram shows the luminosity units over the pixel range. Bottom left, Zones removed by the computer analysis to eliminate zones of GA and light reflex, shown numerically as red vertical lines on the histogram (elimination of luminosity <38 or >250). The MGS-FAF scale is in arbitrary fluorescence density units.
FIGURE 5
FIGURE 5
Standardization curve for fundus autofluorescence (AF) of the confocal scanning laser ophthalmoscope over 120 minutes from start-up. The data points (± standard deviation) were based on standard change in mean AF images intensity from baseline. A standard, highly fluorescent material was used for comparison (closed box) and is represented by the line that remains constant at 255 density units. A turquoise bead is used (closed circle) that has a stable AF after 1 hour at approximately 100 density units. Multiple fluorophores were tested, but the turquoise was the most stable fluorophore in the desired range.
FIGURE 6
FIGURE 6
Scattergram of age (in years) vs MGS levels 1 through 4 in 262 donor eyes graded according to the MGS system shows a strong positive correlation between MGS severity (more advanced age-related macular degeneration) and increasing age (R = 0.49, P < .001).
FIGURE 7
FIGURE 7
Scattergrams comparing the MGS-FAF with age using various regions of the macula comparing mean fluorescence density units (y-axis) to age in years (x-axis): Center (C), inner (I), outer (O). Upper left, MGS-FAF regions C+I+O compared to age, with no significant association (P = .43). Upper right, MGS-FAF in region C compared to age, with no association (P = .43). Lower left, MGS-FAF in the inner region (1000 to 3000 μm) compared to age, with no association (P = .37). Lower right, Outer MGS-FAF in the outer region (3000–6000 μm), with no association (P = .99).
FIGURE 8
FIGURE 8
Scattergram comparing total fundus autofluorescence (tFAF) in mean fluorescence density units to the MGS level of age-related macular degeneration. The peak in the tFAF units occurs at MGS level 2 (P = .002; Tukey Kramer analysis) and declines significantly at MGS level 3 (P < .001) and MGS level 4 (P < .001). Using polynomial regression analysis, this trend is significant (P < .001).
FIGURE 9
FIGURE 9
Basal laminar drusen or cuticular drusen are easily seen in the color photograph as small yellow dots (<100 μm) in the macular and peripapillary region (left). Comparing directly to the fundus autofluorescence (FAF) image (right), the drusen correspond to areas of hypofluorescence. Note that the surrounding area in the FAF image is rather bright (hyperfluorescent), suggesting the presence of lipofuscin (LF) in this 89-year-old woman graded with MGS level 2 age-related macular degeneration.
FIGURE 10
FIGURE 10
Photographic demonstration of reticular pseudodrusen, an uncommon clinical finding that is represented using both the color and fundus autofluorescence (FAF) image. Upper left, First photograph taken in the MGS series, of the partially opaque neurosensory retina in an eye with reticular pseudodrusen, best seen in the superior temporal quadrant as a reticular (netlike) pattern of yellow material. The neurosensory retina is removed and both the right (upper right) and left (lower left) demonstrate both typical drusen near the macula (center ring) and reticular pseudodrusen, best seen in the superior outer ring of the grid in either eye. The FAF image (bottom right) shows the hyperfluorescence of the reticular pseudodrusen in a similar pattern that corresponds to the color image (note the artifact light reflex that is bright white). Numbers on the grid represent the diameter (in μm) of the circle.
FIGURE 11
FIGURE 11
Digital image of “ghost vessels.” A comparison of the fundus autofluorescence (FAF) image (left) that corresponds to the retinal vasculature (right), which remains in the FAF image, even after the retinal vasculature has been removed. Note that the image on the left has already had the neurosensory retina removed, so the retinal blood vessels are not actually present. This “ghost image” phenomenon was common (95 of 262 cases [36%]).

Similar articles

Cited by

References

    1. Buch H, Vinding T, La Cour M, Appleyard M, Jensen GB, Nielsen NV. Prevalence and causes of visual impairment and blindness among 9980 Scandinavian adults: The Copenhagen City Eye Study. Ophthalmology. 2004;111:53–61. - PubMed
    1. Buch H, Vinding T, Nielsen NV. Prevalence and causes of visual impairment according to World Health Organization and United States criteria in an aged, urban Scandinavian population: the Copenhagen City Eye Study. Ophthalmology. 2001;108:2347–2357. - PubMed
    1. Klaver CC, Wolfs RC, Vingerling JR, Hofman A, de Jong PT. Age-specific prevalence and causes of blindness and visual impairment in an older population: the Rotterdam Study. Arch Ophthalmol. 1998;116:653–658. - PubMed
    1. O'Shea JG. Age-related macular degeneration: a leading cause of blindness [see comments] Med J Aust. 1996;165:561–564. - PubMed
    1. Mitchell P, Smith W, Attebo K, Wang JJ. Prevalence of age-related maculopathy in Australia. The Blue Mountains Eye Study. Ophthalmology. 1995;102:1450–1460. - PubMed

Publication types