

Comparison of analyses of the QTLMAS XII common dataset. I: Genomic selection
- PMID: 19278535
- PMCID: PMC2654490
- DOI: 10.1186/1753-6561-3-s1-s1
Comparison of analyses of the QTLMAS XII common dataset. I: Genomic selection
Abstract
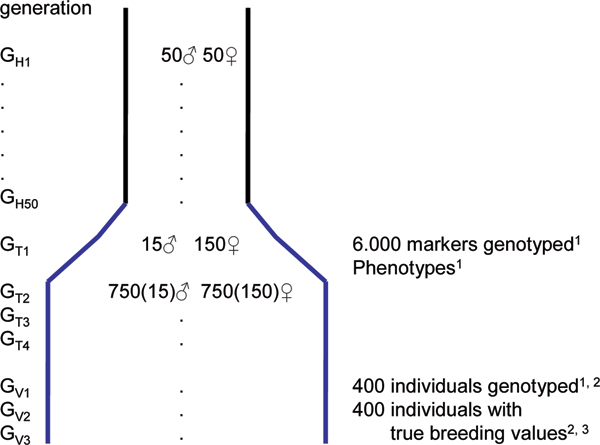
A dataset was simulated and distributed to participants of the QTLMAS XII workshop who were invited to develop genomic selection models. Each contributing group was asked to describe the model development and validation as well as to submit genomic predictions for three generations of individuals, for which they only knew the genotypes. The organisers used these genomic predictions to perform the final validation by comparison to the true breeding values, which were known only to the organisers. Methods used by the 5 groups fell in 3 classes 1) fixed effects models 2) BLUP models, and 3) Bayesian MCMC based models. The Bayesian analyses gave the highest accuracies, followed by the BLUP models, while the fixed effects models generally had low accuracies and large error variance. The best BLUP models as well as the best Bayesian models gave unbiased predictions. The BLUP models are clearly sensitive to the assumed SNP variance, because they do not estimate SNP variance, but take the specified variance as the true variance. The current comparison suggests that Bayesian analyses on haplotypes or SNPs are the most promising approach for Genomic selection although the BLUP models may provide a computationally attractive alternative with little loss of efficiency. On the other hand fixed effect type models are unlikely to provide any gain over traditional pedigree indexes for selection.
Figures
Similar articles
-
A comparison of five methods to predict genomic breeding values of dairy bulls from genome-wide SNP markers.Genet Sel Evol. 2009 Dec 31;41(1):56. doi: 10.1186/1297-9686-41-56. Genet Sel Evol. 2009. PMID: 20043835 Free PMC article.
-
Development of genomic predictions for Angus cattle in Brazil incorporating genotypes from related American sires.J Anim Sci. 2022 Feb 1;100(2):skac009. doi: 10.1093/jas/skac009. J Anim Sci. 2022. PMID: 35031806 Free PMC article.
-
Variable selection models for genomic selection using whole-genome sequence data and singular value decomposition.Genet Sel Evol. 2017 Dec 27;49(1):94. doi: 10.1186/s12711-017-0369-3. Genet Sel Evol. 2017. PMID: 29281962 Free PMC article.
-
Comparison of analyses of the QTLMAS XIII common dataset. I: genomic selection.BMC Proc. 2010 Mar 31;4 Suppl 1(Suppl 1):S1. doi: 10.1186/1753-6561-4-s1-s1. BMC Proc. 2010. PMID: 20380752 Free PMC article.
-
Invited review: Unknown-parent groups and metafounders in single-step genomic BLUP.J Dairy Sci. 2022 Feb;105(2):923-939. doi: 10.3168/jds.2021-20293. Epub 2021 Nov 17. J Dairy Sci. 2022. PMID: 34799109 Review.
Cited by
-
Multi-trait single-step genomic prediction accounting for heterogeneous (co)variances over the genome.Heredity (Edinb). 2020 Feb;124(2):274-287. doi: 10.1038/s41437-019-0273-4. Epub 2019 Oct 22. Heredity (Edinb). 2020. PMID: 31641237 Free PMC article.
-
Pre-selection of markers for genomic selection.BMC Proc. 2011 May 27;5 Suppl 3(Suppl 3):S12. doi: 10.1186/1753-6561-5-S3-S12. BMC Proc. 2011. PMID: 21624168 Free PMC article.
-
Accuracy of genomic prediction for growth and carcass traits in Chinese triple-yellow chickens.BMC Genet. 2014 Oct 15;15:110. doi: 10.1186/s12863-014-0110-y. BMC Genet. 2014. PMID: 25316160 Free PMC article.
-
Genomic prediction in animals and plants: simulation of data, validation, reporting, and benchmarking.Genetics. 2013 Feb;193(2):347-65. doi: 10.1534/genetics.112.147983. Epub 2012 Dec 5. Genetics. 2013. PMID: 23222650 Free PMC article. Review.
-
XVth QTLMAS: simulated dataset.BMC Proc. 2012 May 21;6 Suppl 2(Suppl 2):S1. doi: 10.1186/1753-6561-6-S2-S1. Epub 2012 May 21. BMC Proc. 2012. PMID: 22640408 Free PMC article.
References
-
- Fernando RL, Grossman M. Marker assisted selection using best linear unbiased prediction. Genet Sel Evol. 1989;21:467–477. doi: 10.1051/gse:19890407. - DOI
-
- Haldane JBS. The combination of linkage values and the calculation of distances between the loci of linked factors. J Genet. 1919;8:299–309. doi: 10.1007/BF02983270. - DOI
Grants and funding
LinkOut - more resources
Full Text Sources
