

Estimating genomic breeding values from the QTL-MAS Workshop Data using a single SNP and haplotype/IBD approach
- PMID: 19278536
- PMCID: PMC2654491
- DOI: 10.1186/1753-6561-3-s1-s10
Estimating genomic breeding values from the QTL-MAS Workshop Data using a single SNP and haplotype/IBD approach
Abstract
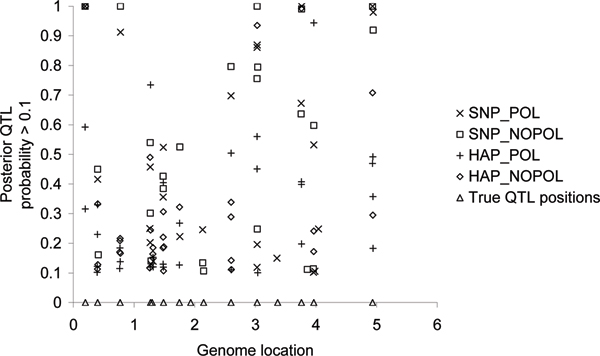
Genomic breeding values were estimated using a Gibbs sampler that avoided the use of the Metropolis-Hastings step as implemented in the BayesB model of Meuwissen et al., Genetics 2001, 157:1819-1829.Two models that estimated genomic estimated breeding values (EBVs) were applied: one used constructed haplotypes (based on alleles of 20 markers) and IBD matrices, another used single SNP regression. Both models were applied with or without polygenic effect. A fifth model included only polygenic effects and no genomic information.The models needed to estimate 366,959 effects for the haplotype/IBD approach, but only 11,850 effects for the single SNP approach. The four genomic models identified 11 to 14 regions that had a posterior QTL probability >0.1. Accuracies of genomic selection breeding values for animals in generations 4-6 ranged from 0.84 to 0.87 (haplotype/IBD vs. SNP).It can be concluded that including a polygenic effect in the genomic model had no effect on the accuracy of the total EBVs or prediction of the QTL positions. The SNP model yielded slightly higher accuracies for the total EBVs, while both models were able to detect nearly all QTL that explained at least 0.5% of the total phenotypic variance.
Figures
Similar articles
-
Effects of the number of markers per haplotype and clustering of haplotypes on the accuracy of QTL mapping and prediction of genomic breeding values.Genet Sel Evol. 2009 Jan 15;41(1):11. doi: 10.1186/1297-9686-41-11. Genet Sel Evol. 2009. PMID: 19284677 Free PMC article.
-
The effect of missing marker genotypes on the accuracy of gene-assisted breeding value estimation: a comparison of methods.Animal. 2010 Jan;4(1):9-19. doi: 10.1017/S1751731109990838. Animal. 2010. PMID: 22443613
-
Alternative haplotype construction methods for genomic evaluation.J Dairy Sci. 2016 Jun;99(6):4537-4546. doi: 10.3168/jds.2015-10433. Epub 2016 Mar 16. J Dairy Sci. 2016. PMID: 26995132
-
Simultaneous QTL detection and genomic breeding value estimation using high density SNP chips.BMC Proc. 2010 Mar 31;4 Suppl 1(Suppl 1):S9. doi: 10.1186/1753-6561-4-s1-s9. BMC Proc. 2010. PMID: 20380763 Free PMC article.
-
Invited review: Genomic selection in dairy cattle: progress and challenges.J Dairy Sci. 2009 Feb;92(2):433-43. doi: 10.3168/jds.2008-1646. J Dairy Sci. 2009. PMID: 19164653 Review.
Cited by
-
Study of whole genome linkage disequilibrium patterns of Iranian water buffalo breeds using the Axiom Buffalo Genotyping 90K Array.PLoS One. 2019 May 31;14(5):e0217687. doi: 10.1371/journal.pone.0217687. eCollection 2019. PLoS One. 2019. PMID: 31150486 Free PMC article.
-
Study of whole genome linkage disequilibrium in Nellore cattle.BMC Genomics. 2013 May 5;14:305. doi: 10.1186/1471-2164-14-305. BMC Genomics. 2013. PMID: 23642139 Free PMC article.
-
Comparison of analyses of the QTLMAS XII common dataset. I: Genomic selection.BMC Proc. 2009 Feb 23;3 Suppl 1(Suppl 1):S1. doi: 10.1186/1753-6561-3-s1-s1. BMC Proc. 2009. PMID: 19278535 Free PMC article.
-
Bayesian genomic selection: the effect of haplotype length and priors.BMC Proc. 2009 Feb 23;3 Suppl 1(Suppl 1):S11. doi: 10.1186/1753-6561-3-s1-s11. BMC Proc. 2009. PMID: 19278537 Free PMC article.
References
-
- George EI, McCulloch RE. Variable selection via gibbs sampling. Journal of the American Statistical Association. 1993;88:881–889. doi: 10.2307/2290777. - DOI
-
- Fernando RL, Grossman M. Marker assisted selection using best linear unbiased prediction. Genet Sel Evol. 1989;214:467–477. doi: 10.1051/gse:19890407. - DOI
LinkOut - more resources
Full Text Sources
