. 2009 Mar 11;17(3):395-405.
doi: 10.1016/j.str.2008.12.017.

Rhomboid protease dynamics and lipid interactions

Affiliations

Rhomboid protease dynamics and lipid interactions

Ana-Nicoleta Bondar et al. Structure. .

Abstract

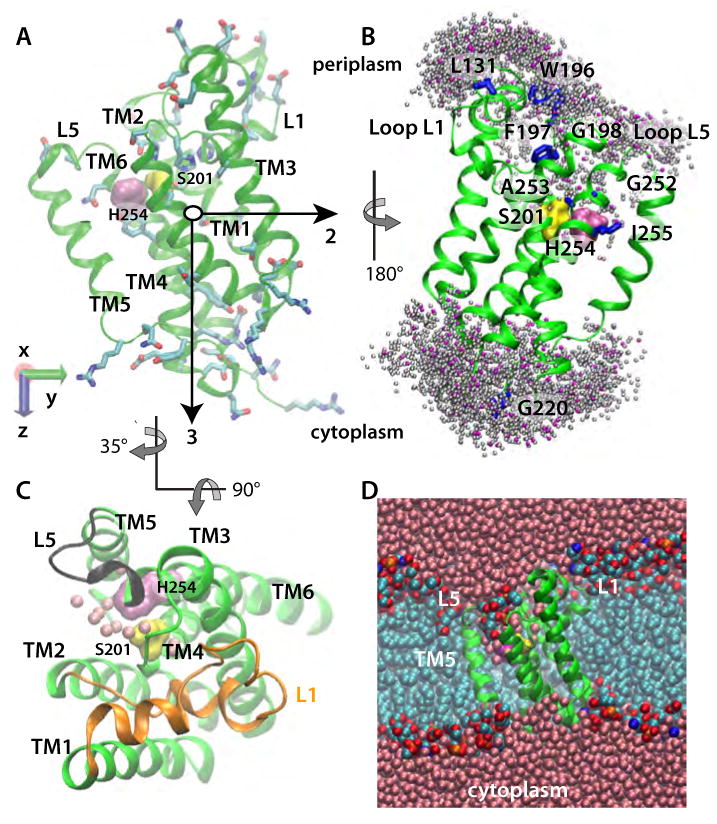
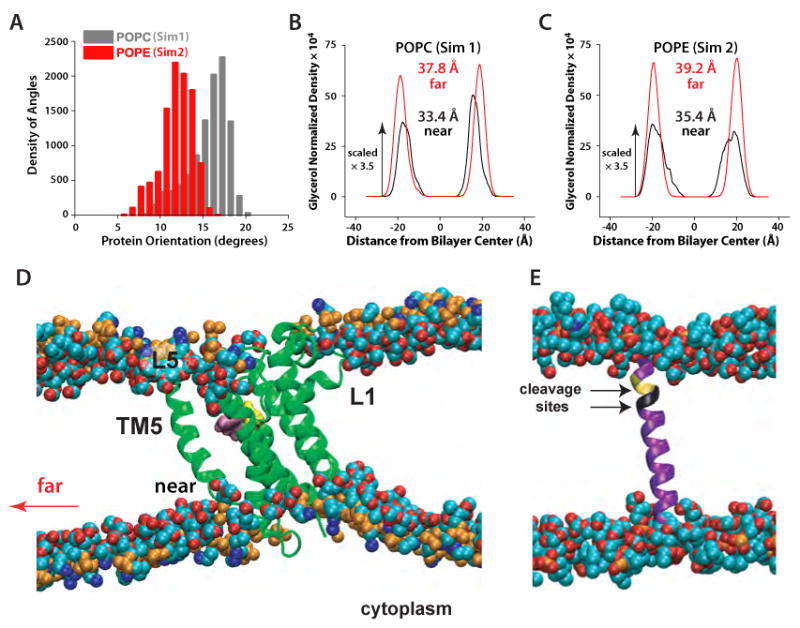
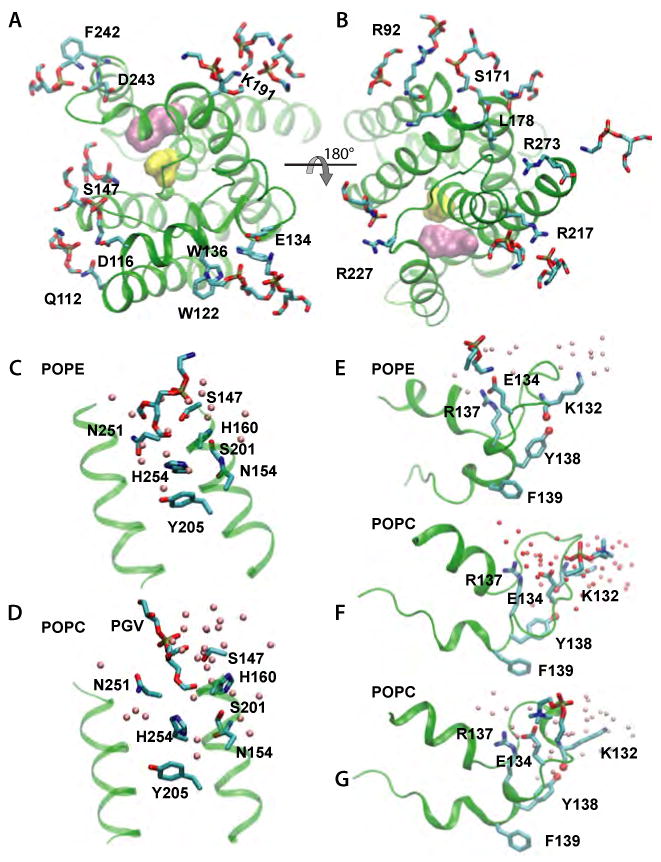
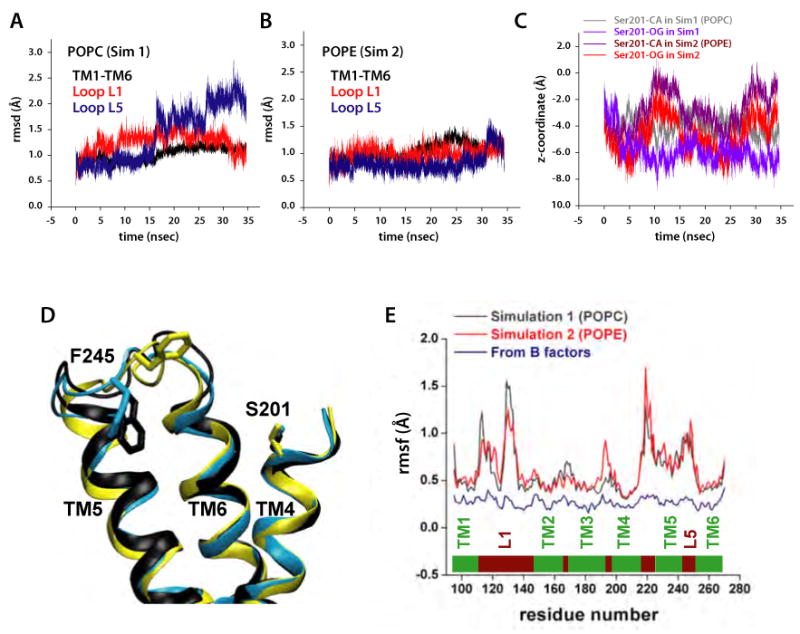
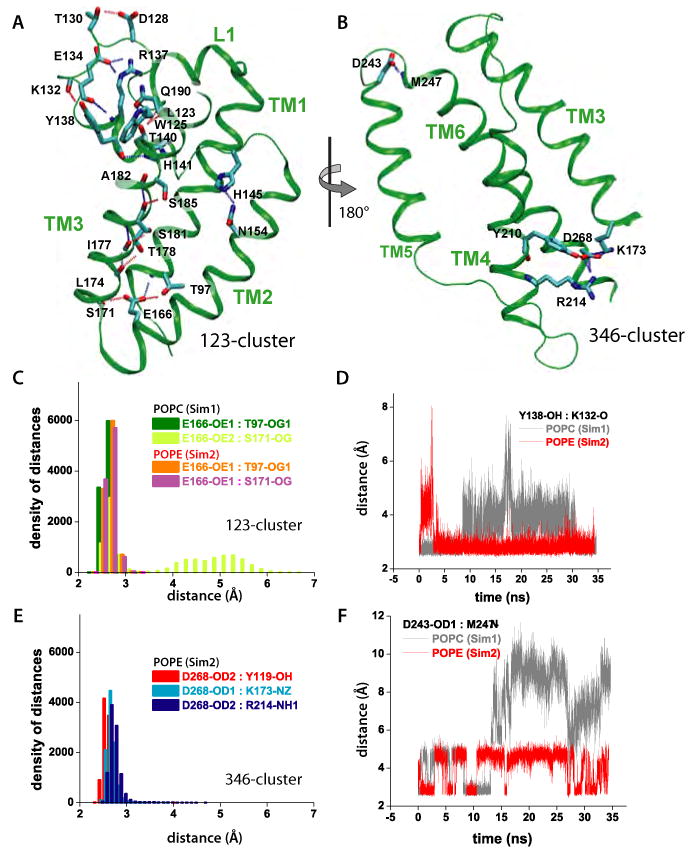
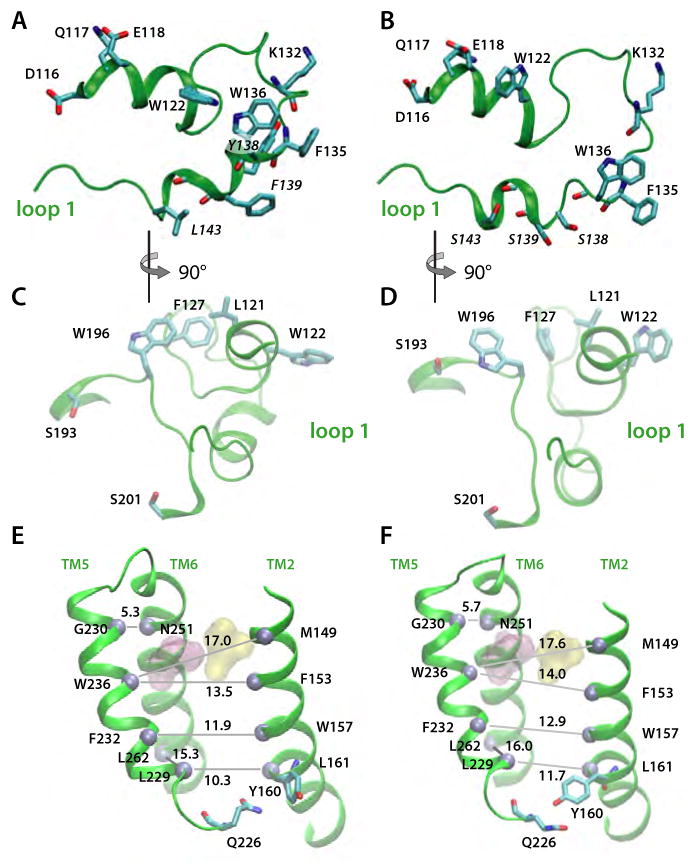
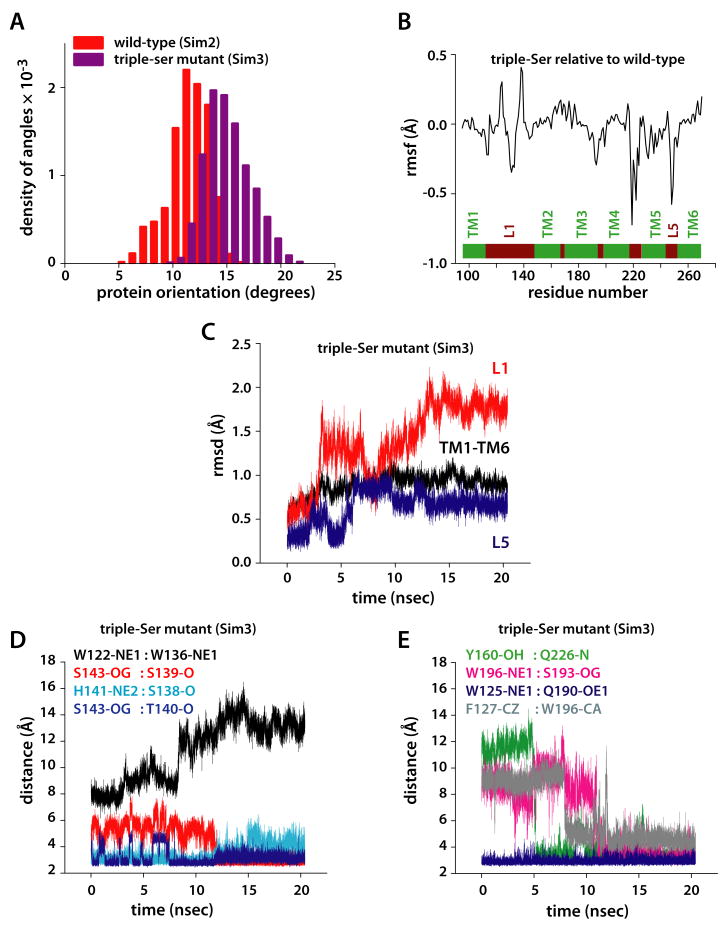
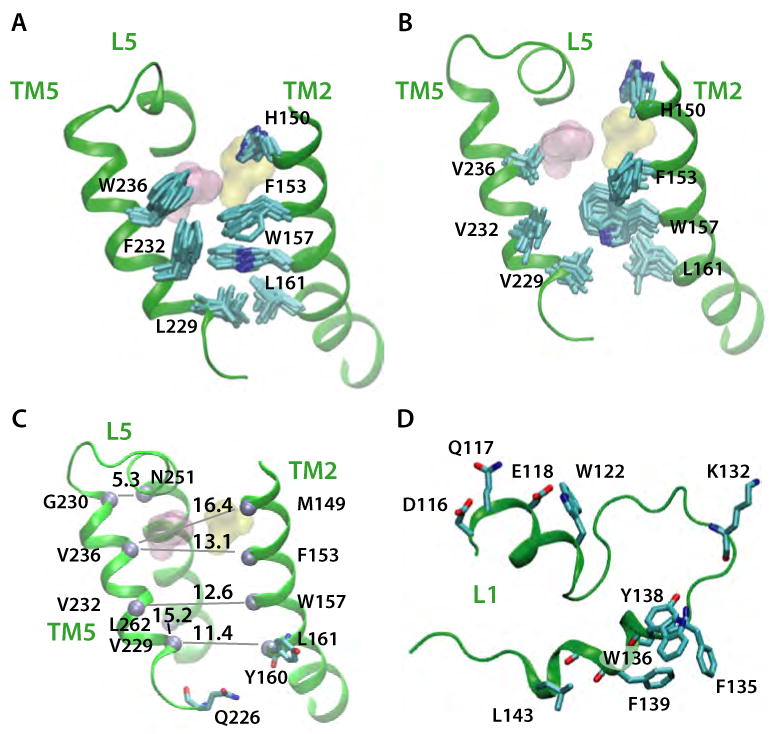
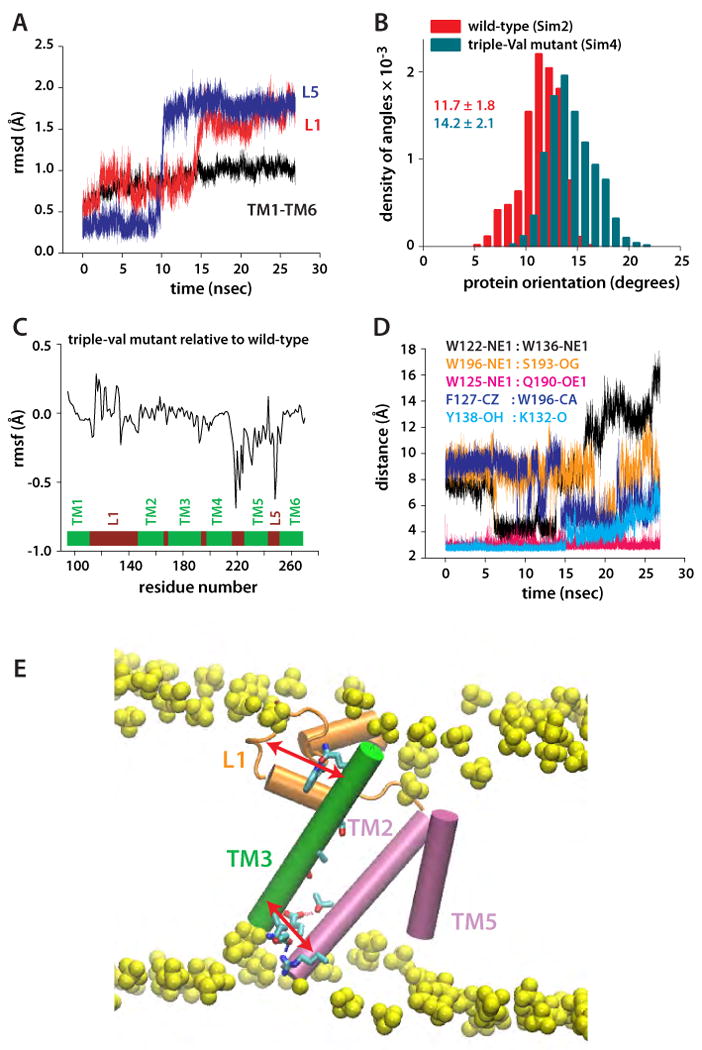
Intramembrane proteases, which cleave transmembrane (TM) helices, participate in numerous biological processes encompassing all branches of life. Several crystallographic structures of Escherichia coli GlpG rhomboid protease have been determined. In order to understand GlpG dynamics and lipid interactions in a native-like environment, we have examined the molecular dynamics of wild-type and mutant GlpG in different membrane environments. The irregular shape and small hydrophobic thickness of the protein cause significant bilayer deformations that may be important for substrate entry into the active site. Hydrogen-bond interactions with lipids are paramount in protein orientation and dynamics. Mutations in the unusual L1 loop cause changes in protein dynamics and protein orientation that are relayed to the His-Ser catalytic dyad. Similarly, mutations in TM5 change the dynamics and structure of the L1 loop. These results imply that the L1 loop has an important regulatory role in proteolysis.


Figures

Figure 1
Figure 1
E. Coli GlpG in a POPE lipid bilayer (Sim2). (A) Starting geometry and principal axes (black arrows) of GlpG. S201 and H254 are shown as yellow and mauve surfaces, respectively; amino acid sidechains with H-bonding capability are depicted as bonds. (B) Dynamic water distribution in the active site. Locations of the water-molecule oxygen atoms located within 5 Å of the protein in a snapshot from Sim2 are shown as pink spheres. Shown in grey are water locations sampled during ten equally spaced snapshots during a subsequent 1ns segment of Sim2. Amino acids known from experiments to be accessible to bulk water (Maegawa et al., 2007) are shown as blue bonds, or as surfaces (S201 and H254). (C) View from the luminal side of GlpG from Sim2, depicting water molecules within 5Å of S201 and H254 as pink spheres, L1 in orange, and L5 in black. (D) Cut away view of GlpG in a POPE lipid bilayer, with the protein shown in green, bulk-water oxygen atoms in pink, lipid alkyl carbon cyan, lipid phosphorus orange, lipid oxygen red, and lipid nitrogen atoms blue.
Figure 2
Figure 2
Local perturbations of lipid bilayers caused by GlpG rhomboid protease. (A) Distribution of orientational angles of GlpG relative to the membrane normal in Sim1 (gray) and Sim2 (red). (B) Hydrocarbon thickness of the POPC bilayers (Sim1) and (C) POPE bilayers (Sim2) close to the protein (black curves; computed from ∼90 lipids within the first 2-3 shells of lipids around the protein) and far from the protein in the unperturbed region of the bilayer (red curves). The hydrocarbon thickness was estimated as the distance between the peaks of the distribution for the glycerol groups of the two lipid leaflets (Wiener and White, 1992) taken along the membrane normal and normalized by the volume of the simulation cell. In the case of the distorted density peaks for POPE lipids close to the protein (z ∼20Å), we used the value of z at the center of the distribution. (D) Thinning of the lipid bilayer close to the protein; only a ∼38 Å-wide section of the bilayer containing the protein is depicted. (E) Snapshot of the Spitz substrate in a POPC lipid bilayer. The two substrate cleavage sites (Baker et al., 2007) are shown in yellow (Ala-Ser) and black (Gly-Ala). Little perturbation of the bilayer in the vicinity of Spitz was observed.
Figure 3
Figure 3
Lipid and water interactions of GlpG in POPC (Sim1) and POPE (Sim2). Pink spheres indicate the location of the bulk water oxygen atoms within 5 Å of the protein amino acid residues shown as bonds. Phospholipid headgroups are also shown as bonds. (A) Luminal interactions of GlpG residues with POPE headgroups. (B) Cytoplasmic interactions of GlpG residues with POPE headgroups. (C) Active site interactions of GlpG in POPE membranes. (D) Active-site interactions of GlpG in a POPC membrane, with a PGV lipid close to the active site. (E) Loop L1 interactions with POPE headgroups. (F,G) Loop L1 interactions with POPC headgroups during a segment of ∼20ns of Sim1 (F) and late in the simulation (G).
Figure 4
Figure 4
Dynamics of GlpG in POPC (Sim1) and POPE (Sim2) bilayers. (A) Dynamics of loops L1 (red), L5 (blue), and of helices TM1-TM6 (black) in POPC and (B) POPE bilayers measured as the rmsd (Å) relative to the starting crystal structure coordinates. (C) Position of the catalytic S201 in POPC (Sim1) and POPE (Sim2) bilayers. (D) Conformations sampled by L5 in POPC (Sim1) during the time periods 0-15ns (yellow), 15-25ns (cyan), and 25-34.5ns (black). (E) Rmsf (Å) of GlpG residues in Sim1 (black, POPC) and Sim2 (red, POPE) are dramatically greater than those computed from the crystal structure B-factors, shown in blue (Ben-Shem et al., 2007).
Figure 5
Figure 5
Intra-protein H-bonding of GlpG. (A) H-bonding within L1 and TM1/TM2/TM3 (123-cluster). (B) H-bonding within TM3/TM4/TM6 (346-cluster). For simplicity, only the backbone carbonyl or amide groups are depicted for non-polar residues. (C) Histograms of H-bonding distances in the 123-cluster for POPC and POPE. The E166-S171 H-bond breaks and reforms in POPC. (D) Effect of lipid-type on the dynamics of the Y138-K132 H-bonding in the 123-cluster. (E) Histograms of H-bonding distances within the 346 cluster in POPE. The histograms for the 346-cluster are very similar for POPE and POPC (data not shown). (F) Dynamics of H-bonds in the lipid interface of L5 depend upon lipid type.
Figure 6
Figure 6
Simulation snapshots illustrating relay of Loop L1 perturbations to the substrate access site in the triple-Ser mutant (Y138S/F139S/L143S). Snapshots of the wild-type and mutant conformations are shown in the left-hand (A,C,E) and right-hand (B,D,F) panels, respectively. (A) Periplasmic view of L1 in the wild-type protein. All distances are in Å. (B) Periplasmic view of L1 in the triple-Ser mutant. (C). View of wild-type L1 viewed from the active site. site in the wild-type protein (D) View of triple-ser L1 from the active site. (E) Mean spacing between selected Cα atoms (gray spheres) in TM2/TM5/TM6 for the wild-type protein. (F) Mean Cα spacings for triple-Ser mutant. For panels E and F, the standard deviations of the distances are ≤ 0.6Å.
Figure 7
Figure 7
Dynamics of the triple-Ser mutant (Y138S/F139S/L143S) in POPE (Sim3). (A) Histograms of the orientation of the protein relative to the membrane normal (measured in degrees) in the wild-type (red) and the triple-Ser mutant (wine). (B) Rmsf (in Å) of the amino acid residues in the triple-Ser mutant relative to the wild-type protein. (C) Rmsd (in Å) of the triple-Ser mutant relative to the equilibrated structure of wild-type GlpG in POPE (Sim2). (D) Dynamics of selected distances in the triple-Ser mutant involving amino acids from L1. (E) Dynamics of selected distances in the triple-Ser mutant involving amino acids not in the L1 loop.
Figure 8
Figure 8
Simulation snapshots showing structural changes in TM5 of the triple-Val mutant in POPE (Sim4). Snapshots of wild-type and mutant conformations are shown in the left-hand (A,C) and right-hand (B,D) panels, respectively. (A) Loop L5, TM2, and TM5 in the wild-type protein (B) Same features as in for the triple-Val mutant (B). (C) Effect of the triple-Val mutant on the average distances between TM5, TM2, and TM6 Cα atoms (gray spheres). Compare with the distances in Figure 6E. All distances are average values (given in Å), with standard deviations ≤ 0.6 Å. (D) Snapshot of loop L1 at the end of Sim4. Compare with Figure 6A.
Figure 9
Figure 9
Protein orientation and dynamics of the triple-Val mutant (W236V/F232V/L229V). (A) Rmsd of TM1-TM6 and of loops L1 and L5, relative to the starting coordinates. The spontaneous and nearly simultaneous switching of L1 and L5 suggest conformational coupling between TM2/TM5 and L1. (B) Orientation of triple-Val GlpG (compare with Figure 7A). (C) Changes in the rmsf of triple-Val GlpG relative to the wild-type are observed not only in the region of TM5, but also in L1. (D) Dynamics of selected intra-protein interactions in Sim4 indicating that perturbation of TM5 is transmitted to L1. (E) Suggested relay mechanism in GlpG. Due to the array of H-bonds along TM3 (green), this structural element can act as a rigid arm that relays perturbations between L1 (orange) and the TM2/TM5 helices (orange) through intra-helical and L1:TM3 H-bonding.

References

    1. Baker RP, Young K, Feng L, Shi Y, Urban S. Enzymatic analysis of a rhomboid intramembrane protease implicates transmembrane helix 5 as the lateral substrate gate. Proc Natl Acad Sci USA. 2007;104:8257–8262. - PMC - PubMed
    1. Baran KL, Chimenti MS, Schlessman JL, Fitch CA, Herbst KJ, Garcia-Moreno BE. Electrostatic effects in a network of polar and ionizable groups in Staphylococcal nuclease. J Mol Biol. 2008;379:1045–1062. - PubMed
    1. Ben-Shem A, Fass D, Bibi E. Structural basis for intramembrane proteolysis by rhomboid serine proteases. Proc Natl Acad Sci USA. 2007;104:462–466. - PMC - PubMed
    1. Bier E, Jan LY, Jan YN. rhomboid, a gene required for dosoventral axis establishment and peripheral nervous system develompent in Drosophila melanogaster. Genes Dev. 1990;4:190–203. - PubMed
    1. Brooks BR, Bruccoleri RE, Olafson BD, States DJ, Swaminathan S, Karplus M. CHARMM: A program for macromolecular energy, minimization, and dynamics. J Comput Chem. 1983;4:187–217.

Publication types

MeSH terms