. 2009 Sep;28(9):1436-47.
doi: 10.1109/TMI.2009.2016958. Epub 2009 Mar 10.

Automated 3-D intraretinal layer segmentation of macular spectral-domain optical coherence tomography images

Affiliations

Automated 3-D intraretinal layer segmentation of macular spectral-domain optical coherence tomography images

Mona Kathryn Garvin et al. IEEE Trans Med Imaging. 2009 Sep.

Abstract

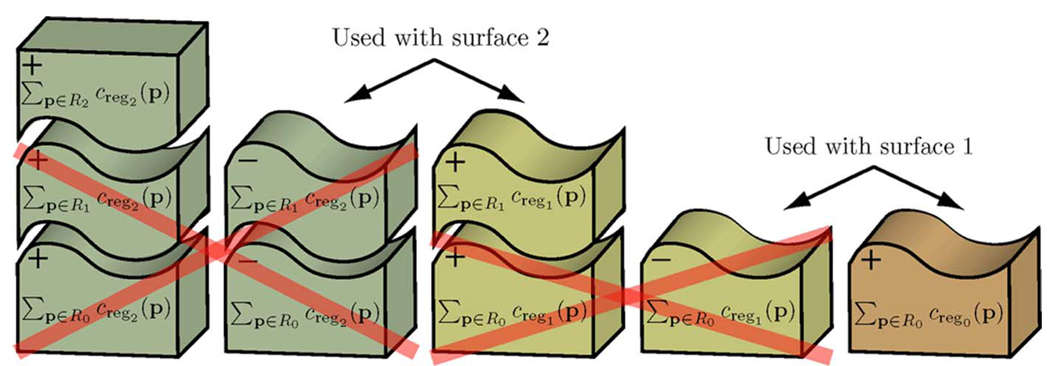
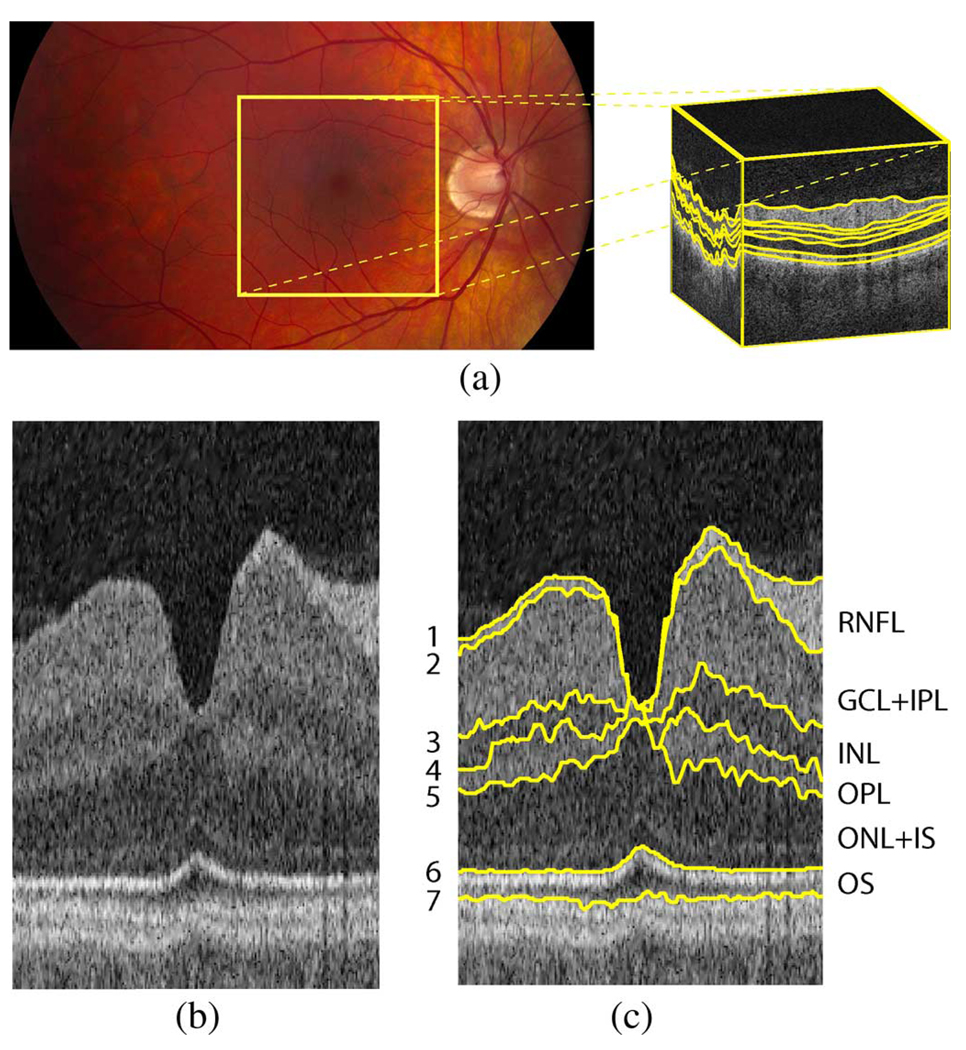
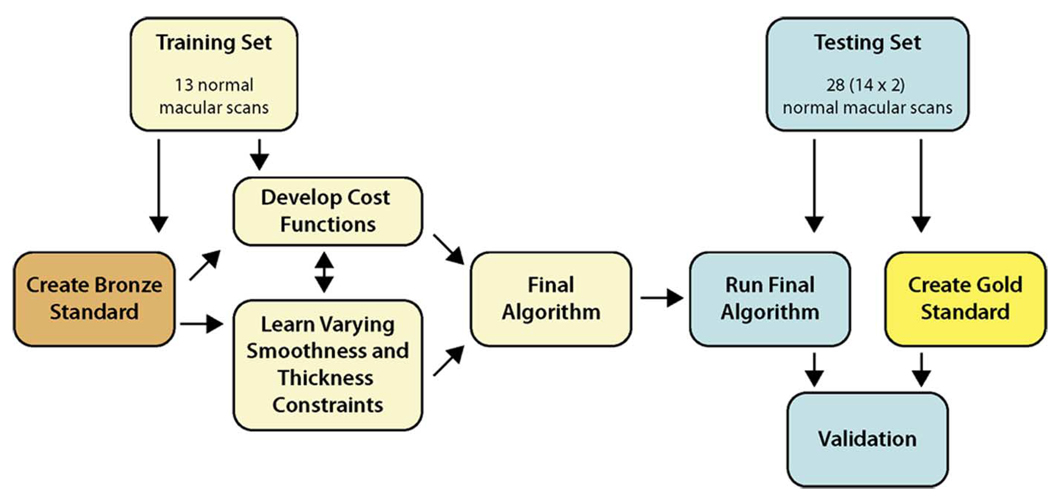
With the introduction of spectral-domain optical coherence tomography (OCT), much larger image datasets are routinely acquired compared to what was possible using the previous generation of time-domain OCT. Thus, the need for 3-D segmentation methods for processing such data is becoming increasingly important. We report a graph-theoretic segmentation method for the simultaneous segmentation of multiple 3-D surfaces that is guaranteed to be optimal with respect to the cost function and that is directly applicable to the segmentation of 3-D spectral OCT image data. We present two extensions to the general layered graph segmentation method: the ability to incorporate varying feasibility constraints and the ability to incorporate true regional information. Appropriate feasibility constraints and cost functions were learned from a training set of 13 spectral-domain OCT images from 13 subjects. After training, our approach was tested on a test set of 28 images from 14 subjects. An overall mean unsigned border positioning error of 5.69+/-2.41 microm was achieved when segmenting seven surfaces (six layers) and using the average of the manual tracings of two ophthalmologists as the reference standard. This result is very comparable to the measured interobserver variability of 5.71+/-1.98 microm.


Figures

Fig. 1
Fig. 1
Review of optimal 3-D graph search approach. The multiple surface segmentation problem is transformed into the graph-theoretic problem of finding a minimum-cost closed set in a geometric graph. The graph is constructed so that the structure of the graph reflects the feasibility constraints and the vertex weights of the graph reflect the cost function. The minimum-cost closed set is found in the constructed graph by finding a minimum s- t cut in a closely related graph.
Fig. 2
Fig. 2
Example schematic cost of two surfaces for the multiple surface segmentation problem. The two surfaces divide the volume into three regions.
Fig. 3
Fig. 3
Graph representation of feasibility constraints. (a), (b) One subgraph is created for each surface to be found with the added edges enforcing the surface smoothness constraints. In this example, the column denoted col2(x1,y1) is a neighbor to the column denoted col2 (x2,y2). Both columns belong to the graph for surface 2. (c), (d) Intersurface edges are added between the surface subgraphs to enforce the surface interaction constraints. Here, col2(x0,y0) is the column at (x0,y0) belonging to the subgraph for surface 2 and col1(x0,y0) is the column at (x0,y0) belonging to the subgraph for surface 1.
Fig. 4
Fig. 4
Schematic showing how the assignment of in-region costs to vertices produces the desired overall cost.
Fig. 5
Fig. 5
Illustration of surfaces to be segmented on macular spectral-domain OCT images. (a) Fundus photograph with schematic OCT volume (size 6×6×2 mm3) with surfaces indicated with yellow lines. (b) Example slice (flattened/truncated) from the center of an OCT volume. (c) Seven surfaces (and corresponding six layers) on example slice. (RNFL = retinal nerve fiber layer, GCL + IPL = ganglion cell layer and inner plexiform layer, INL = inner nuclear layer, OPL = outer plexiform layer, ONL + IS = outer nuclear layer and photoreceptor inner segments, and OS = photoreceptor outer segments. Note that the anatomical correspondence is our current presumption, but the precise correspondence of the outermost layers still remains a subject of discussion [3].
Fig. 6
Fig. 6
Example slices from a macular spectral-domain OCT volume. (a) Slice 0. (b) Slice 55. (c) Slice 99. (d) Slice 154. (e) Slice 198.
Fig. 7
Fig. 7
Rendering of spectral OCT image before and after flattening. (a) Volume rendering before flattening. (b) Volume rendering after flattening.
Fig. 8
Fig. 8
Spectral training/testing flowchart.
Fig. 9
Fig. 9
Regions for randomly selecting slices for the macular spectral OCT independent standard (one slice was randomly chosen from each region).
Fig. 10
Fig. 10
Visualization of learned thickness constraints for the layer bounded by surfaces 2 and 3. The minimum and maximum thickness constraints are illustrated in the first and third column, respectively, while the mean thicknesses are illustrated in the second column. Each image is oriented so that the temporal side is on the left and the nasal side is on the right.
Fig. 11
Fig. 11
Learned smoothness constraints in x-direction for surface 2.
Fig. 12
Fig. 12
Unsigned border positioning error results for different combinations of edge and regional information on training set.
Fig. 13
Fig. 13
Example 7-surface 3-D segmentation results shown on five slices used for validation on one spectral-domain image in the test set (median case according to overall mean unsigned positioning error). (a) Slice 25. (b) Slice 25. (c) Slice 68. (d) Slice 68. (e) Slice 101. (f) Slice 101. (g) Slice 141. (h) Slice 141. (i) Slice 181. (j) Slice 181.

References

    1. Wojtkowski M, Leitgeb R, Kowalczyk A, Bajraszewski T, Fercher AF. In vivo human retinal imaging by Fourier domain optical coherence tomography. J. Biomed. Opt. 2002 Jul;vol. 7(no. 3):457–463. - PubMed
    1. de Boer JF, Cense B, Park BH, Pierce MC, Tearney GJ, Bouma BE. Improved signal-to-noise ratio in spectral-domain compared with time-domain optical coherence tomography. Opt. Lett. 2003 Nov;vol. 28(no. 21):2067–2069. - PubMed
    1. Drexler W, Fujimoto JG. State-of-the-art retinal optical coherence tomography. Progress Retinal Eye Res. 2008;vol. 27(no. 1):45–88. - PubMed
    1. Koozekanani D, Boyer K, Roberts C. Retinal thickness measurements in optical coherence tomography using a Markov boundary model. Proc. IEEE Conf. Comput. Vis. Pattern Recognit. 2000 Jun;vol. 2:363–370. - PubMed
    1. Koozekanani D, Boyer K, Roberts C. Retinal thickness measurements from optical coherence tomography using a Markov boundary model. IEEE Trans. Med. Imag. 2001 Sep;vol. 20(no. 9):900–916. - PubMed

Publication types

MeSH terms