

Reactive oxygen species are not required for an arsenic trioxide-induced antioxidant response or apoptosis
- PMID: 19279006
- PMCID: PMC2676019
- DOI: 10.1074/jbc.M806546200
Reactive oxygen species are not required for an arsenic trioxide-induced antioxidant response or apoptosis
Abstract
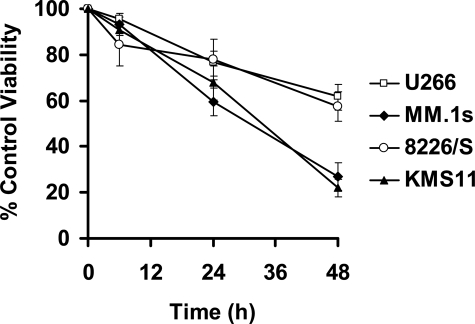
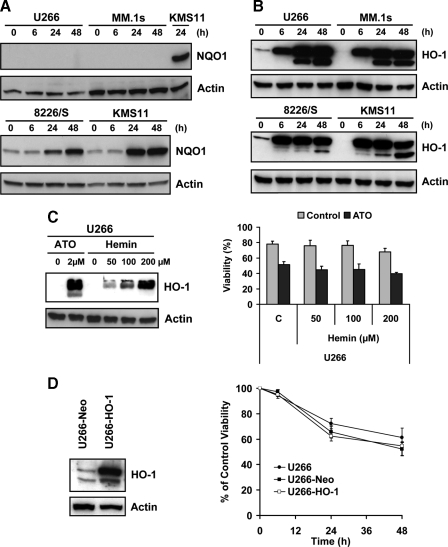
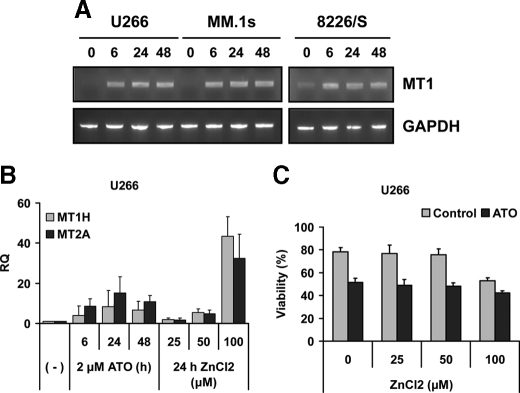
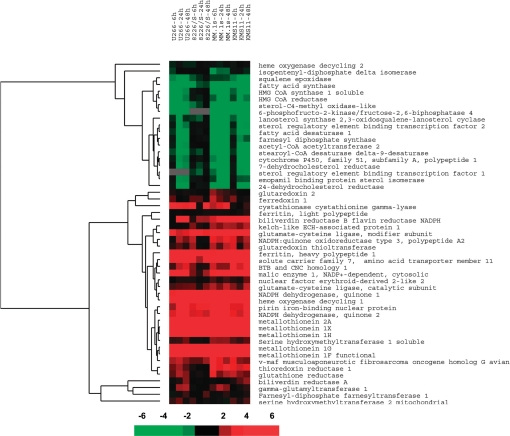
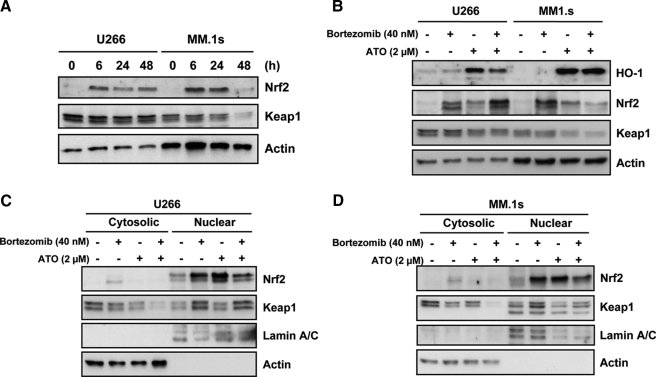
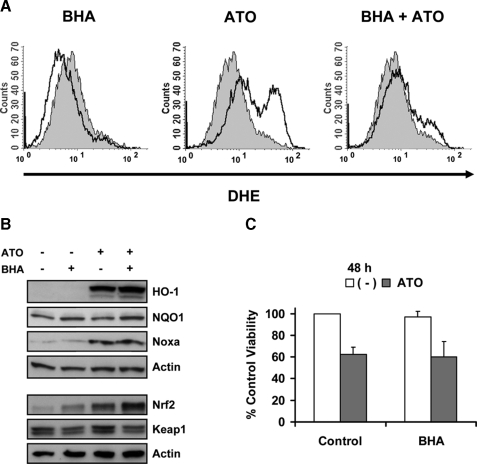
Arsenicals are both environmental carcinogens as well as therapeutic agents for the treatment of trypanosomiasis and more recently cancer. Arsenic trioxide (ATO) has been successfully used for the treatment of acute promyelocytic leukemia (APL) and has activity in multiple myeloma (MM). While signaling events associated with carcinogenesis have been well studied, it still remains to be determined which of these events are involved in anti-cancer signaling. To better define this response, gene expression profiling following ATO treatment of four MM cell lines was performed. The pattern was consistent with a strong antioxidative response, particularly of genes activated by Nrf2. While Nrf2 is expressed constitutively at the mRNA level, the protein is not detected in untreated cells. Consistent with inactivation of Keap1, Nrf2 protein is stabilized and present in the nucleus within 6 h of ATO treatment. Despite the activation of this antioxidative response, ROS may not be important in ATO-induced death. Inhibition of ATO-induced ROS with butylated hydroxyanisole (BHA) does not affect Nrf2 activation or cell death. Moreover, silencing Nrf2 had no effect on ATO-induced apoptosis. Together these data suggest that ROS is not important in the induction of the antioxidative response or cellular death by ATO.
Figures

Similar articles
-
Arsenic trioxide-induced cytotoxicity in small cell lung cancer via altered redox homeostasis and mitochondrial integrity.Int J Oncol. 2015 Mar;46(3):1067-78. doi: 10.3892/ijo.2015.2826. Epub 2015 Jan 9. Int J Oncol. 2015. PMID: 25572414
-
Inhibition of heme oxygenase-1 enhances anti-cancer effects of arsenic trioxide on glioma cells.J Neurooncol. 2011 Sep;104(2):449-58. doi: 10.1007/s11060-010-0513-1. Epub 2011 Feb 17. J Neurooncol. 2011. PMID: 21327864
-
Arsenic Trioxide and Venetoclax Synergize against AML Progenitors by ROS Induction and Inhibition of Nrf2 Activation.Int J Mol Sci. 2022 Jun 12;23(12):6568. doi: 10.3390/ijms23126568. Int J Mol Sci. 2022. PMID: 35743010 Free PMC article.
-
Molecular targets of arsenic trioxide in malignant cells.Oncologist. 2002;7 Suppl 1:14-9. doi: 10.1634/theoncologist.7-suppl_1-14. Oncologist. 2002. PMID: 11961205 Review.
-
Interaction between arsenic trioxide and human primary cells: emphasis on human cells of myeloid origin.Inflamm Allergy Drug Targets. 2009 Mar;8(1):21-7. doi: 10.2174/187152809787582516. Inflamm Allergy Drug Targets. 2009. PMID: 19275690 Review.
Cited by
-
Downregulation of Mcl-1 through GSK-3β activation contributes to arsenic trioxide-induced apoptosis in acute myeloid leukemia cells.Leukemia. 2013 Feb;27(2):315-24. doi: 10.1038/leu.2012.180. Epub 2012 Jul 3. Leukemia. 2013. PMID: 22751450 Free PMC article.
-
Autophagic degradation of the BCR-ABL oncoprotein and generation of antileukemic responses by arsenic trioxide.Blood. 2012 Oct 25;120(17):3555-62. doi: 10.1182/blood-2012-01-402578. Epub 2012 Aug 16. Blood. 2012. PMID: 22898604 Free PMC article.
-
Arsenic trioxide-mediated suppression of miR-182-5p is associated with potent anti-oxidant effects through up-regulation of SESN2.Oncotarget. 2018 Mar 23;9(22):16028-16042. doi: 10.18632/oncotarget.24678. eCollection 2018 Mar 23. Oncotarget. 2018. PMID: 29662624 Free PMC article.
-
Ethacrynic acid and a derivative enhance apoptosis in arsenic trioxide-treated myeloid leukemia and lymphoma cells: the role of glutathione S-transferase p1-1.Clin Cancer Res. 2012 Dec 15;18(24):6690-701. doi: 10.1158/1078-0432.CCR-12-0770. Epub 2012 Oct 18. Clin Cancer Res. 2012. PMID: 23082001 Free PMC article.
-
Activation of the Nrf2 pathway by inorganic arsenic in human hepatocytes and the role of transcriptional repressor Bach1.Oxid Med Cell Longev. 2013;2013:984546. doi: 10.1155/2013/984546. Epub 2013 May 7. Oxid Med Cell Longev. 2013. PMID: 23738048 Free PMC article.
References
-
- Wang, Z. Y., and Chen, Z. (2006) Blood 111 2505-2515 - PubMed
-
- Berenson, J. R., and Yeh, H. S. (2006) Clin. Lymphoma Myeloma. 7 192-198 - PubMed
-
- Hussein, M. A. (2001) Med. Oncol. 18 239-242 - PubMed
-
- Kalmadi, S. R., and Hussein, M. A. (2006) Acta Haematol. 116 1-7 - PubMed
-
- Bahlis, N. J., McCafferty-Grad, J., Jordan-McMurry, I., Neil, J., Reis, I., Kharfan-Dabaja, M., Eckman, J., Goodman, M., Fernandez, H. F., Boise, L. H., and Lee, K. P. (2002) Clin. Cancer Res. 8 3658-3668 - PubMed
Publication types
MeSH terms
Substances
Grants and funding
LinkOut - more resources
Full Text Sources
Other Literature Sources
Medical
