Comparative Study
. 2009 Mar 11;29(10):3148-59.
doi: 10.1523/JNEUROSCI.5206-08.2009.

Dynamic encoding of action selection by the medial striatum

Affiliations
Comparative Study

Dynamic encoding of action selection by the medial striatum

Eyal Yaacov Kimchi et al. J Neurosci. .

Abstract

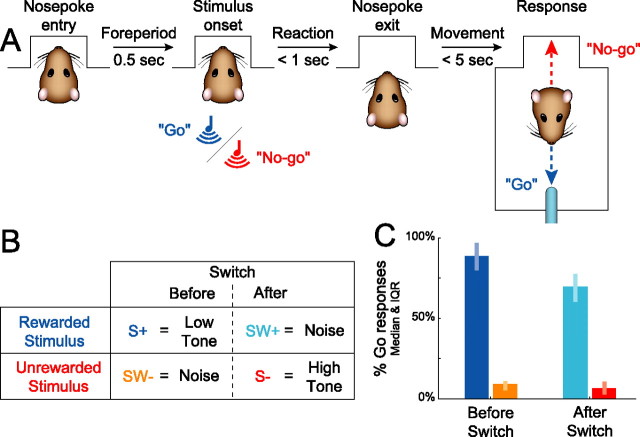
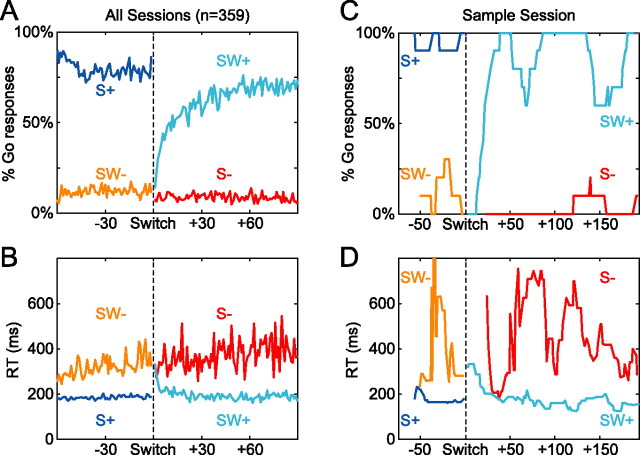
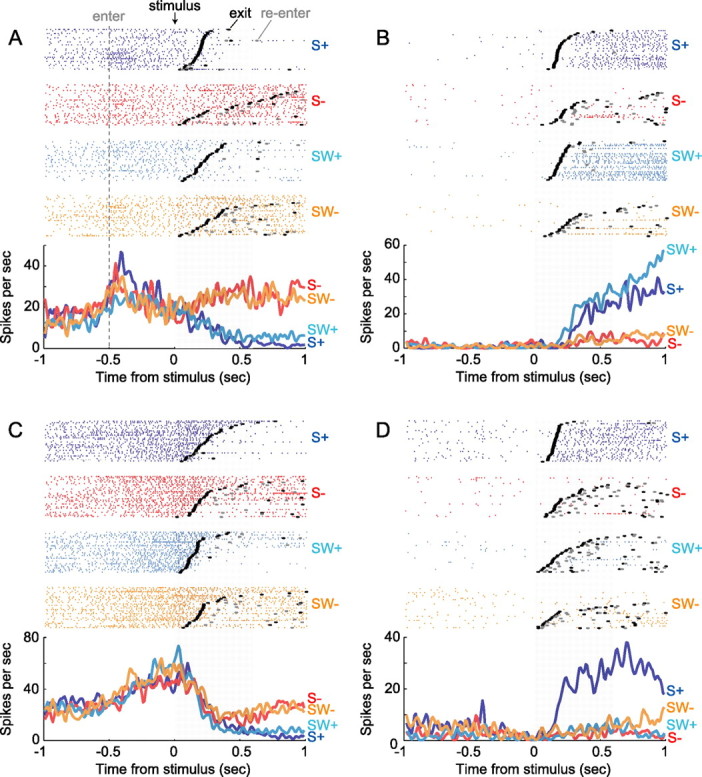
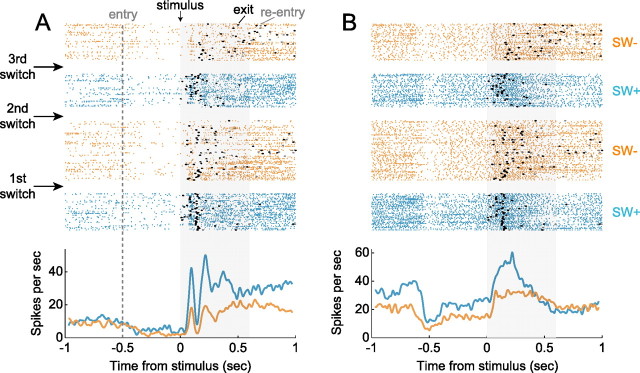
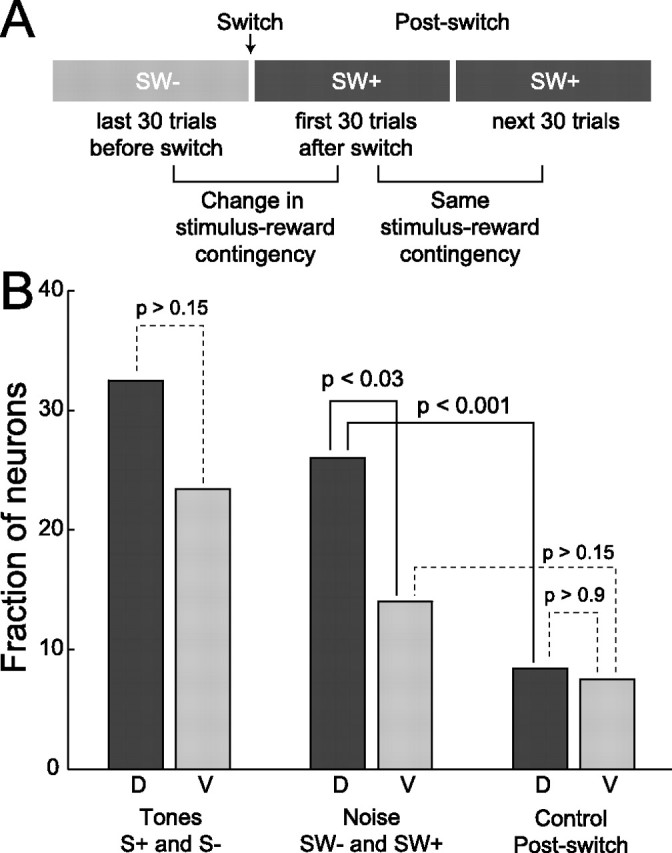
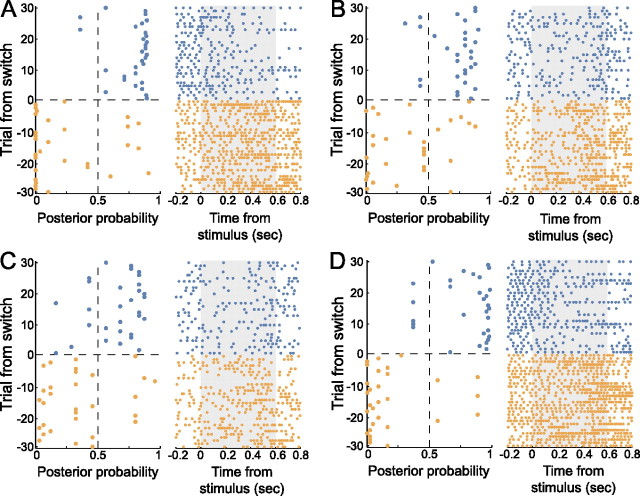
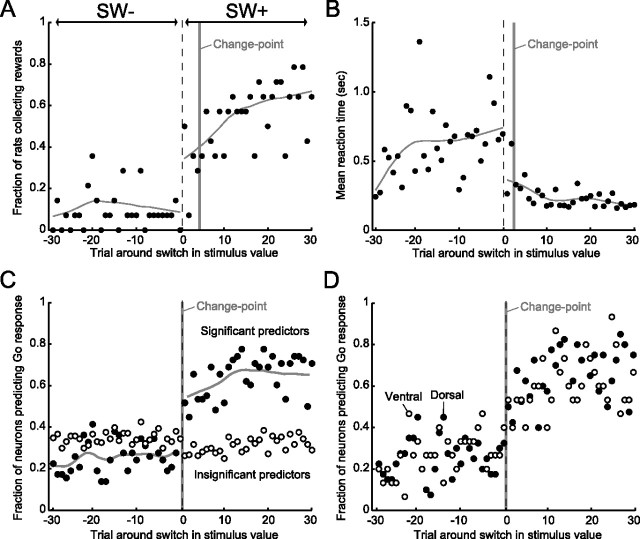
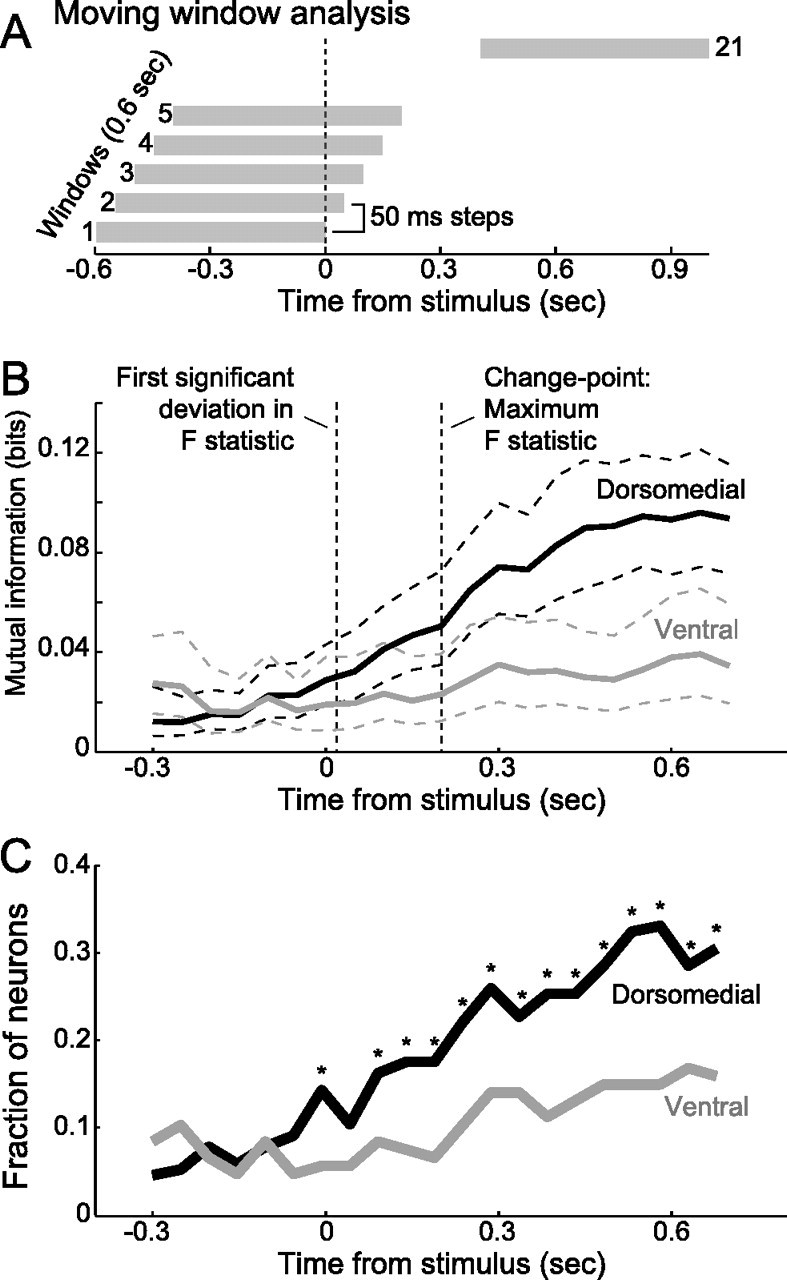
Successful foragers respond flexibly to environmental stimuli. Behavioral flexibility depends on a number of brain areas that send convergent projections to the medial striatum, such as the medial prefrontal cortex, orbital frontal cortex, and amygdala. Here, we tested the hypothesis that neurons in the medial striatum are involved in flexible action selection, by representing changes in stimulus-reward contingencies. Using a novel Go/No-go reaction-time task, we changed the reward value of individual stimuli within single experimental sessions. We simultaneously recorded neuronal activity in the medial and ventral parts of the striatum of rats. The rats modified their actions in the task after the changes in stimulus-reward contingencies. This was preceded by dynamic modulations of spike activity in the medial, but not the ventral, striatum. Our results suggest that the medial striatum biases animals to collect rewards to potentially valuable stimuli and can rapidly influence flexible behavior.


Figures

Figure 1.
Figure 1.
Go/No-go discrimination task. A, Rats initiated trials by poking their snouts into a hole (nosepoke entry) on one side of the chamber. They had to maintain this position for 0.5 s until a stimulus was delivered (onset of a tone, noise, or light), withdraw from the hole within 1 s of stimulus onset (nosepoke exit), and then decide whether to cross the chamber to collect a reward. A rapid withdrawal followed by an attempt to collect a reward was termed a “Go response” and resulted in water delivery only on trials with rewarded stimuli (+). If an animal attempted to make a Go response to unrewarded stimuli (−), no water was delivered and the trial repeated (i.e., an unrewarded stimulus was presented on the next trial). B, In the first half of a switch session, the rewarded stimulus was a low-frequency (8 kHz) tone that was presented on half of trials (S+). The unrewarded stimulus was called the “switching stimulus” (SW−; noise, shown here, or light). Once rats achieved a criterion level of performance (90% correct over 20 trials), the reward contingencies were changed for the switching stimulus. Responses to it were now rewarded (SW+), and a high-frequency (30 kHz) tone, which was never rewarded, was presented on half of the trials (S−). C, Rats were able to adapt their behavior successfully after a switch in reward contingencies. Before the switch, rats made Go responses primarily to S+ (low tone, blue) and minimally to SW− (e.g., noise, orange). Following the switch, rats made Go responses primarily to the now rewarded switching stimulus (SW+, e.g., noise, light blue) and not to the S− (high tone, red). Data are presented from all of the recording sessions (14 rats, 2 recording sessions per rat).
Figure 2.
Figure 2.
Effects of stimulus value on behavioral performance. A, The proportions of trials with Go responses are shown for all behavioral sessions (359 training and recording sessions from 17 rats). Rats were initially more likely to make Go responses to the rewarded stimulus (S+, the low-frequency tone, blue) than the switching stimulus (SW−, orange). After the change stimulus–reward contingencies (vertical dashed line), animals made Go responses to the switching stimulus (SW+, light blue) and not to the unrewarded stimulus (S−, high-frequency tone, red). B, Group data for the animals' reaction times are shown. Specifically, the median RT for each trial relative to the switch in action selection is plotted for all behavioral sessions. Rats initiated responses more quickly to rewarded (S+, SW+) than unrewarded stimuli (SW−, S−). C, The proportion of Go responses is shown for an example session (same colors as in A). The proportion of Go responses is plotted as a 10-trial running mean where a Go response is scored as 1, and a No-go response is scored as 0. After the switch in reward contingencies, the rat began to respond consistently to SW+. D, Corresponding reaction time data for the same example session (as a 10-trial running median). The rat initiated responses more quickly to rewarded than unrewarded stimuli.
Figure 3.
Figure 3.
Locations of recordings. The locations of the recording sites are depicted using horizontal sections. A, 341 neurons were localized to the medial striatum (black dots). B, 211 neurons were localized to the ventral striatum, including the core of the nucleus accumbens. There were no significant differences in waveform sizes or overall firing rates between the medial and ventral neurons (rank-sum test, p > 0.05). Atlas figures are adapted (Paxinos and Watson, 1998).
Figure 4.
Figure 4.
Neuronal activity related to components of action selection. Four examples of neurons that varied with various components of the task are shown. Activity is aligned to the onset of the stimuli. Rasters are shown in the upper portion of each panel, are separated by stimulus–reward pairing, and are sorted by reaction time (shortest RTs shown at the bottom). The bottom panels show peri-event histograms for each stimulus–reward condition and depict spike-density functions measured using a Gaussian kernel (width of 10 ms). A, This neuron was a leading decoder of a change in stimulus–reward contingency, with accuracy >80%. The neuron was modulated during the delay period (−0.5–0 s) but showed a reduced firing rate after rewarded stimuli. In contrast, it fired persistently throughout the reaction time epoch after unrewarded stimuli. Thus, the neuron fired in a very different manner to the same stimulus depending on the value (SW+ vs SW−). This activity represents what type of response would be rewarded, regardless of what response is actually made. B, A neuron that fired during Go responses to S+ and SW+ and decoded the change in the stimulus–reward contingency, with accuracy >80%. C, A neuron that strongly varied with the reaction time, but not with the stimulus–reward contingency (accuracy <60%). D, A neuron that fired only during locomotor behavior triggered by the low frequency tone. This neuron did not vary with the change in stimulus–reward contingencies (accuracy <60%) and was recorded during a session when the rat did not rapidly switch its behavior. Such an activity pattern was relatively rare.
Figure 5.
Figure 5.
Reproducibility of neuronal changes to repeated switches in action selection. Two medial striatal neurons are shown that were recorded simultaneously in an animal that went through three switches in stimulus–reward associations. The neurons provide evidence that the rat striatum is reproducibly altered after multiple changes in stimulus–reward contingency. This session used a light stimulus as the switching stimulus. The beginning of the session is at the bottom of the rasters, with later trials in the session above. Rasters in light blue depict portions of the session when the switching stimulus was rewarded (SW+). Rasters in orange depict portions of the session when the switching stimulus was unrewarded (SW−). A, This neuron fired more after the stimulus and again during response initiation to SW+ compared with SW−. B, This neuron fired at an overall higher rate in blocks when the switching stimulus was rewarded (SW+) compared with blocks when the switching stimulus was not rewarded (SW−). This activity can represent whether a Go response to a switching stimulus would be rewarded, regardless of what the stimulus or response will be on a particular trail.
Figure 6.
Figure 6.
Stimulus–reward contingencies can be decoded with medial striatal neuronal activity. A, The organization of trials for the decoding analysis is shown. To assess neuronal sensitivity to changes in stimulus–reward contingency, firing rates on the last 30 trials before the switch were compared with the first 30 trials after the switch (SW− vs SW+). The first trial after the switch was defined as the first presentation of SW+ after an S−. To control for nonspecific effects over the experimental sessions, we compared neuronal activity from the first 30 SW+ trials to activity from the next 30 SW+ trials. B, The fractions of neurons that significantly discriminated between trial types are shown by area. The middle columns demonstrate that significantly more medial neurons were sensitive to a switch in the stimulus–reward contingency than ventral neurons (40/154 medial, dark gray bar, vs 15/107 ventral, light gray bar, Proportions test: χ2 = 4.73, p < 0.03). For the medial, but not ventral, neurons this was significantly greater than changes observed in the control period (40 vs 13 medial neurons; χ2: 15.41, df = 1, p < 10−3; 15 vs 8 ventral neurons; χ2: 1.75, p > 0.15). Ventral neurons could, however, significantly decode stimulus–reward contingencies for the tone stimuli, which had fixed reward values throughout training. Approximately equal proportions of neurons in the medial and ventral striatum decoded these stimuli (ventral: S+ vs S−: 25 of 107, >23.4%, compared with SW− vs SW+ as above; χ2: 3.87, df = 1, p < 0.05). These results, together, suggest that changes in action selection to a stimulus with flexible reward value are represented by neurons in the medial, but not the ventral, striatum.
Figure 7.
Figure 7.
Rapid decoding of action selection after a change in stimulus–reward contingency. Neurons that were leading decoders of stimulus–reward contingency in one experimental session are shown. Posterior probabilities from the decoding (SW− vs SW+) are shown on the left for trials with unrewarded switching stimuli (SW−, orange) and with rewarded switching stimuli (SW+, light blue). The probabilities of Go responding changed from low to high after the first presentation of the unrewarded tone (S− presented at trial 0, compare trials −30 to −1 with trials 1 to 30). Neuronal firing patterns associated with each posterior probability are shown on the right. The time epoch that was analyzed with the decoding method is highlighted by the gray boxes in the raster plot (stimulus onset at 0 to 600 ms after).
Figure 8.
Figure 8.
Dynamics of neuronal and behavioral measures of action selection after changes in stimulus–reward contingency. A, The plot shows the proportion of rats that collected rewards on trials with switching stimuli (SW) surrounding a switch in reward contingencies (SW− to SW+). The left part of the plot shows trials when the switching stimulus was unrewarded (SW−). The right part of the plot shows trials when the switching stimulus was rewarded (SW+). The behavioral data here is from 10 rats that were used for decoding analysis (rats that changed based on stimulus context and that were accurate after the switch in stimulus–reward contingency). The change point for all panels was calculated using a structural change test as described in Materials and Methods. B, Mean reaction times on trials before and after the switch in reward contingencies. C, D, The fractions of neurons that successfully predicted a rewarded stimulus on each trial surrounding a switch in reward contingencies. Before the switch, ∼20% of neurons predicted a rewarded stimulus (incorrect predictions). After the switch, ∼70% of neurons predicted a rewarded stimulus (correct predictions). C, Predictions of reward stimuli based on firing rates of neurons in the striatum (both medial and ventral) are shown for neurons that were significant predictors (black) and those that were not (white). Change-point analysis identified the first trial after the switch as containing significantly different information for significant predictors. There was no systematic increase in information in nonpredictive neurons at the time of the switch. D, Results are depicted for significant predictors of the change in stimulus–reward contingency from medial (black) and ventral (white) striatum. The results suggest that there are neurons in both parts of the striatum with similar dynamic across trials. However, the proportion of such neurons is significantly greater in the medial striatum (see Fig. 6).
Figure 9.
Figure 9.
Time course of changes in neuronal activity within a trial. A, A “moving window” analysis was used to quantify the time course of changes in neuronal activity after a change in stimulus–reward contingencies. Firing rates were measured using a 0.6 s time-window that was stepped in 0.05 s increments over the period from 0.6 s before to 0.4 s after the onset of the switching stimulus (SW−/SW+ noise). A probabilistic classifier was trained and tested with firing rate from each neuron in each time-window. B, Decoding of changes in stimulus–reward contingencies was due to information that began to grow at the time of the stimulus (denoted by the left vertical dashed line in Fig. 9B, labeled “First significant deviation in F statistic”) and reached a maximum level at ∼0.2 s after stimulus onset (denoted by the right vertical dashed line in Fig. 9B, labeled “Change-point”). More information was accumulated across the population of medial striatum neurons (black line ± 95% confidence interval) than ventral striatum neurons (gray line ± 95% confidence interval). Results are graphed at the center of each window step. C, The proportion of neurons that decode stimulus–reward contingencies for flexible stimuli (SW− vs SW+) increases earlier and more robustly in the medial striatum (black line) than ventral striatum (gray line). Asterisks indicate time-points at which the proportions between medial and ventral striatum differed significantly (Proportions test: χ2 p < 0.05).

Similar articles

Cited by

References

    1. Adams S, Kesner RP, Ragozzino ME. Role of the medial and lateral caudate-putamen in mediating an auditory conditional response association. Neurobiol Learn Mem. 2001;76:106–116. - PubMed
    1. Amalric M, Koob GF. Depletion of dopamine in the caudate nucleus but not in nucleus accumbens impairs reaction-time performance in rats. J Neurosci. 1987;7:2129–2134. - PMC - PubMed
    1. Apicella P, Ljungberg T, Scarnati E, Schultz W. Responses to reward in monkey dorsal and ventral striatum. Exp Brain Res. 1991;85:491–500. - PubMed
    1. Balleine BW, Delgado MR, Hikosaka O. The role of the dorsal striatum in reward and decision-making. J Neurosci. 2007;27:8161–8165. - PMC - PubMed
    1. Barry D, Hartigan JA. A Bayesian analysis for change point problems. J Am Stat Assoc. 1993;88:309–319.

Publication types

LinkOut - more resources