Comparative Study
. 2009 Mar 11;29(10):3160-71.
doi: 10.1523/JNEUROSCI.3941-08.2009.

Diffusion tensor magnetic resonance imaging of Wallerian degeneration in rat spinal cord after dorsal root axotomy

Affiliations
Comparative Study

Diffusion tensor magnetic resonance imaging of Wallerian degeneration in rat spinal cord after dorsal root axotomy

Jiangyang Zhang et al. J Neurosci. .

Abstract

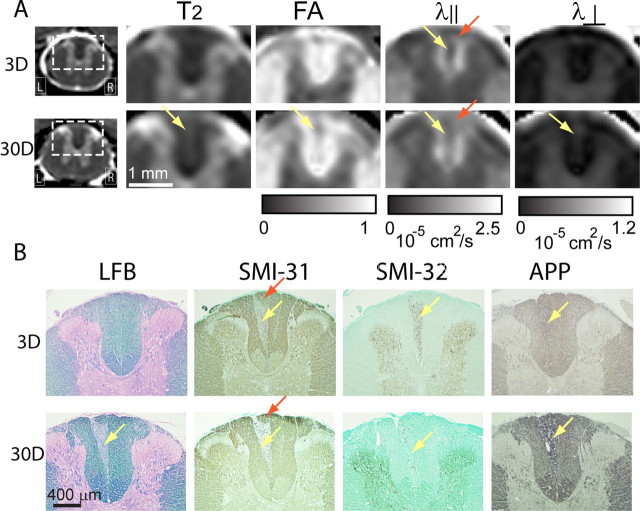
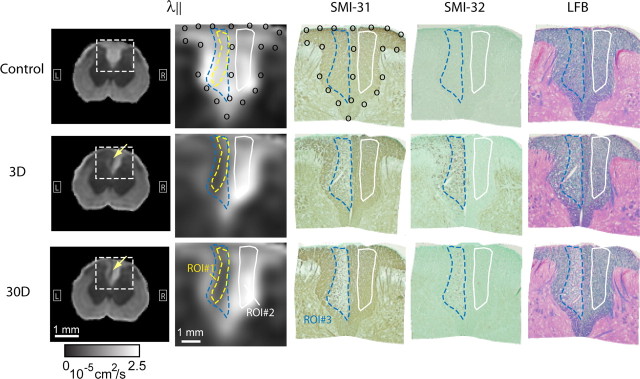
Diffusion tensor imaging (DTI) and immunohistochemistry were used to examine axon injury in the rat spinal cord after unilateral L(2)-L(4) dorsal root axotomy at multiple time points (from 16 h to 30 d after surgery). Three days after axotomy, DTI revealed a lesion in the ipsilateral dorsal column extending from the lumbar to the cervical cord. The lesion showed significantly reduced parallel diffusivity and increased perpendicular diffusivity at day 3 compared with the contralateral unlesioned dorsal column. These findings coincided with loss of phosphorylated neurofilaments, accumulation of nonphosphorylated neurofilaments, swollen axons and formation of myelin ovoids, and no clear loss of myelin (stained by Luxol fast blue and 2'-3'-cyclic nucleotide 3'-phosphodiesterase). At day 30, DTI of the lesion continued to show significantly decreased parallel diffusivity. There was a slow but significant increase in perpendicular diffusivity between day 3 and day 30, which correlated with gradual clearance of myelin without further significant changes in neurofilament levels. These results show that parallel diffusivity can detect axon degeneration within 3 d after injury. The clearance of myelin at later stages may contribute to the late increase in perpendicular diffusivity, whereas the cause of its early increase at day 3 may be related to changes associated with primary axon injury. These data suggest that there is an early imaging signature associated with axon transections that could be used in a variety of neurological disease processes.


Figures

Figure 1.
Figure 1.
Single-subject axial T2-weighted (T2), FA, parallel diffusivity (λ), and perpendicular diffusivity (λ) images of L2 spinal cords of uninjured rats (control) and rats 38 h (38H), 3 d (3D), 7 d (7D), and 30 d (30D) after dorsal root axotomy. The insets in the λ image show enlarged dorsal column white matter. Yellow arrows indicate lesions in the dorsal column. R, Right; L, left (here and in all applicable figures).
Figure 2.
Figure 2.
A, Single-subject horizontal images of FA, parallel diffusivity (λ), and perpendicular diffusivity (λ) showing lesion in the dorsal column at 3 d (left) and 30 d (right) after dorsal root axotomy. The locations of the lesion in the dorsal column are indicated by yellow arrows. The unit of the color bars for the parallel and perpendicular diffusivity images is 10−5 cm2/s. B, Serial axial parallel diffusivity images at four different levels along the spinal cords at 3 d (left) and 30 d (right) after axotomy with streamlines generated by fiber tracking (FT) in the ipsilateral and contralateral dorsal column. Tracking of the ipsilateral streamlines started from seed pixels within the lesion at L2, whereas tracking of the contralateral streamlines started from seed pixels in the contralateral dorsal column at L2. These streamlines are color coded by the local FA, λ, and λ values [FT(FA), FT(λ), and FT(λ), respectively] along each streamline. The unit of the color bars for the parallel and perpendicular diffusivity images is 10−5 cm2/s. The axial locations of these selected images are indicated by the dashed lines in the images in A. The locations of the lesions are indicated by yellow arrows. In the ipsilateral dorsal column, the streamlines generated by fiber tracking starting at the lesion at L2 closely follow the lesion at other levels. C, Renderings of diffusion tensors as three-dimensional ellipsoids in the dorsal columns at 3 d (left) and 30 d (right) after axotomy. The yellow arrows indicate the locations of the lesions. For each tensor, the lengths of the three axes of each tensor are proportional to the three eigenvalues, and the color reflects the FA value. The two insets in the middle show magnified views of individual diffusion tensors as three-dimensional ellipsoids in the lesion and contralateral dorsal column at 30 d after axotomy.
Figure 3.
Figure 3.
A, LFB-, SMI-31-, SMI-32-, and APP-stained histological images of L2 dorsal column at different time points after axotomy. B, CNPase-, GFAP-, and Iba-1-stained histological images of L2 dorsal column at 3 and 30 d after axotomy.
Figure 4.
Figure 4.
A, LFB-, SMI-31-, SMI-32-, and APP-stained histological images (magnification, 10×) show vacuolations (indicated by black arrowheads) in the lesions at 3 d (3D) and 30 d (30D) after axotomy. No vacuolation is visible in uninjured dorsal column (control). B, Toluidine blue-stained histological images (magnification, 100×) of the lesion. Yellow arrows indicate the locations of several myelin ovoids in the lesion.
Figure 5.
Figure 5.
A, Single-subject axial T2-weighted (T2), FA, parallel diffusivity (λ), and perpendicular diffusivity (λ) images of T5 rat spinal cords at 3 and 30 d after dorsal root axotomy. Visible lesions are indicated by the yellow arrows. In the FA, λ and λ images, only the portion of the dorsal column is shown. In the parallel diffusivity images, a triangular region indicated by the red arrows may contain axons that arise from the dorsal roots caudal to those transected. B, Matching LFB-, SMI-31-, SMI-32-, and APP-stained histological images of T5 rat spinal cord dorsal column at 3 and 30 d after dorsal root axotomy. Red arrows indicate regions that contain axons arise from the uninjured dorsal roots caudal to those transected in this study.
Figure 6.
Figure 6.
Average parallel diffusivity (λ) images of L2 rat spinal cords from control animals and animals at 3 and 30 d after dorsal root axotomy (n = 4 for each group) and coregistered SMI-31-, SMI-32-, and LFB-stained histological images. Images in the second column show enlarged dorsal column area in the average λ images. The yellow dashed line outlines the boundary of the lesion as defined in the average λ image at 30 d after axotomy (ROI#1). The blue dashed line outlines the region with loss of phosphorylated neurofilament in the SMI-31-stained histology at 30 d after axotomy (ROI#3). The white line outlines normal white matter in the contralateral dorsal column (ROI#2).
Figure 7.
Figure 7.
A, B, Time courses of FA, parallel diffusivity, and perpendicular diffusivity in the lesion after axotomy from ROI#1 (A) and ROI#3 (B), and contralateral ROI#2 (A, B) (Fig. 6) (see Materials and Methods). Note that the horizontal axis uses log scale. *Significant difference exists between control and injured animals (p < 0.01 after correction for multiple comparisons). C, Profiles of lesion FA, parallel diffusivity, and perpendicular diffusivity in L1–L3 spinal cord obtained from fiber tracking results. D, Optical density of SMI-31 and LFB in the lesion (ROI#3) and contralateral (ROI#2) white matter. E, Correlations between parallel diffusivity and optic density of SMI-31 and correlation between perpendicular diffusivity and optical density of LFB in the lesion (ROI#3) and contralateral white matter (ROI#2).

References

    1. Agosta F, Absinta M, Sormani MP, Ghezzi A, Bertolotto A, Montanari E, Comi G, Filippi M. In vivo assessment of cervical cord damage in MS patients: a longitudinal diffusion tensor MRI study. Brain. 2007;130:2211–2219. - PubMed
    1. Asanuma T, Doblas S, Tesiram YA, Saunders D, Cranford R, Yasui H, Inanami O, Smith N, Floyd RA, Kotake Y, Towner RA. Visualization of the protective ability of a free radical trapping compound against rat C6 and F98 gliomas with diffusion tensor fiber tractography. J Magn Reson Imaging. 2008;28:574–587. - PubMed
    1. Assaf Y, Cohen Y. Non-mono-exponential attenuation of water and N-acetyl aspartate signals due to diffusion in brain tissue. J Magn Reson. 1998;131:69–85. - PubMed
    1. Basser PJ, Pierpaoli C. Microstructural and physiological features of tissues elucidated by quantitative-diffusion-tensor MRI. J Magn Reson B. 1996;111:209–219. - PubMed
    1. Basser PJ, Pierpaoli C. A simplified method to measure the diffusion tensor from seven MR images. Magn Reson Med. 1998;39:928–934. - PubMed

Publication types