Comparative Study
. 2009 Mar 11;29(10):3276-87.
doi: 10.1523/JNEUROSCI.4707-08.2009.

Uniquely hominid features of adult human astrocytes

Affiliations
Comparative Study

Uniquely hominid features of adult human astrocytes

Nancy Ann Oberheim et al. J Neurosci. .

Abstract

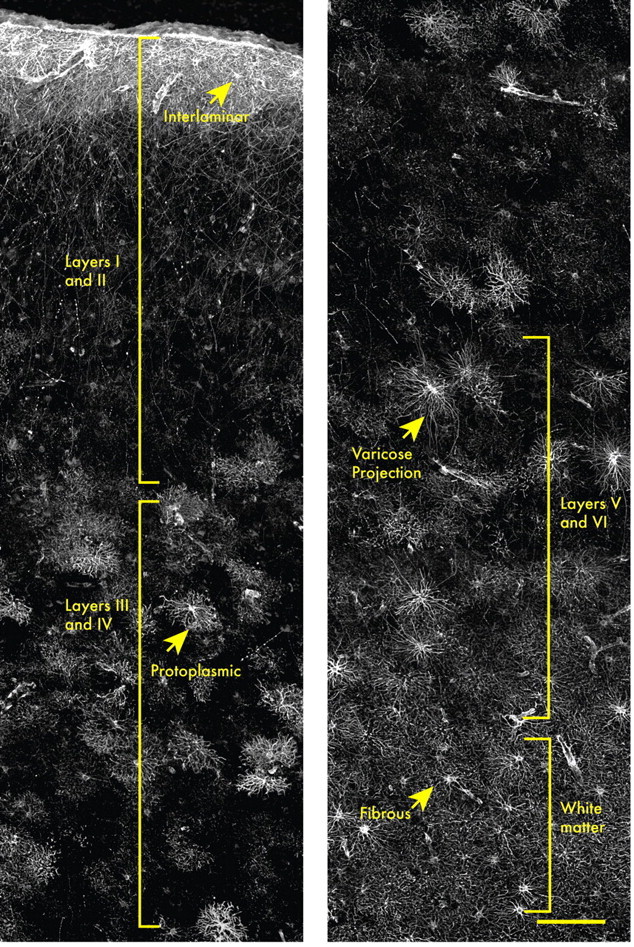
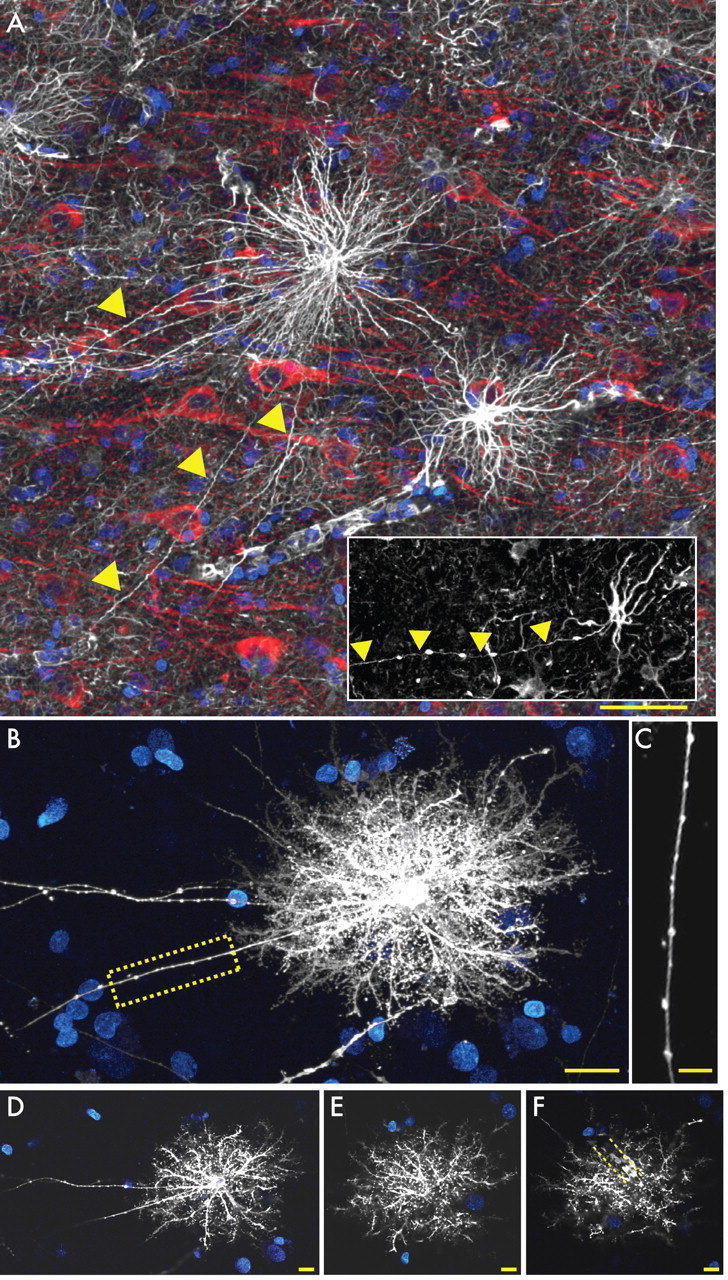
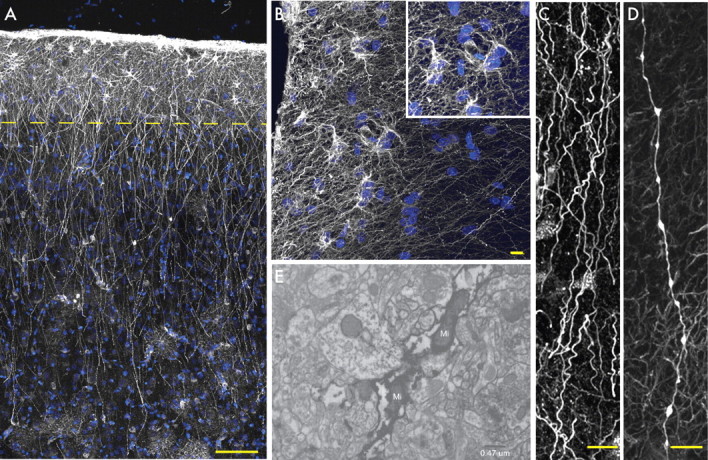
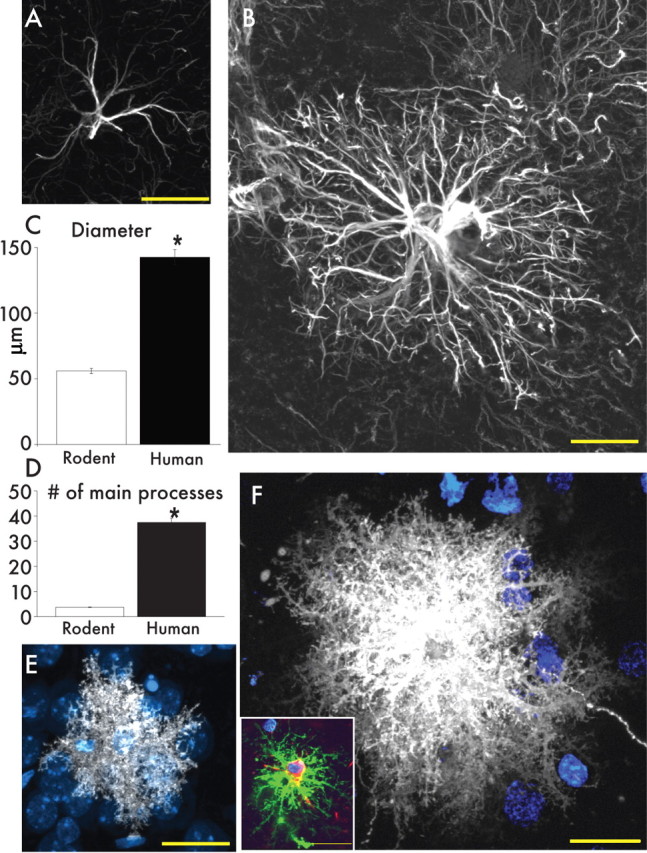
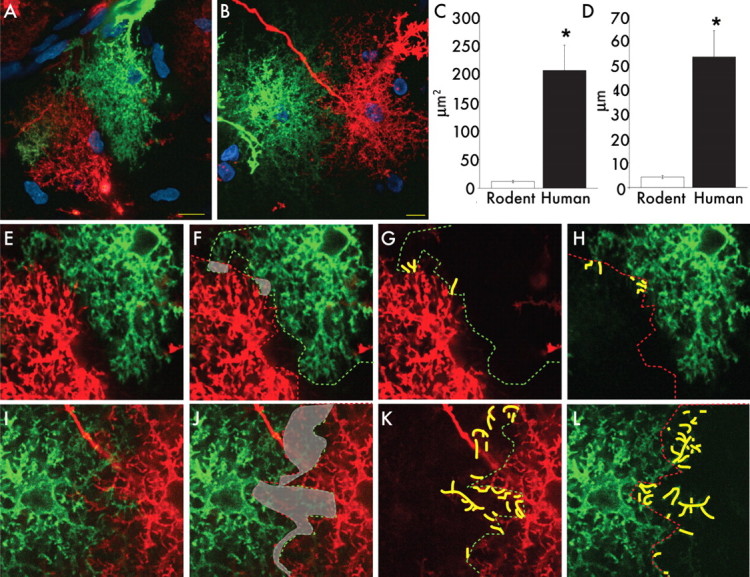
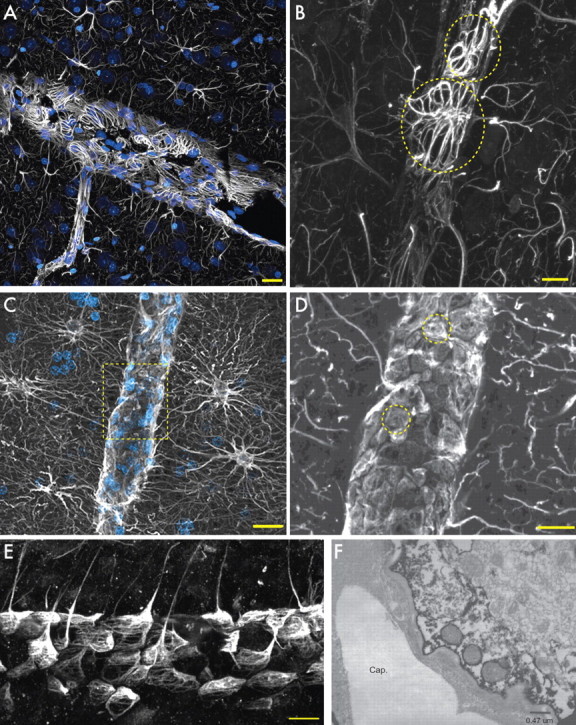
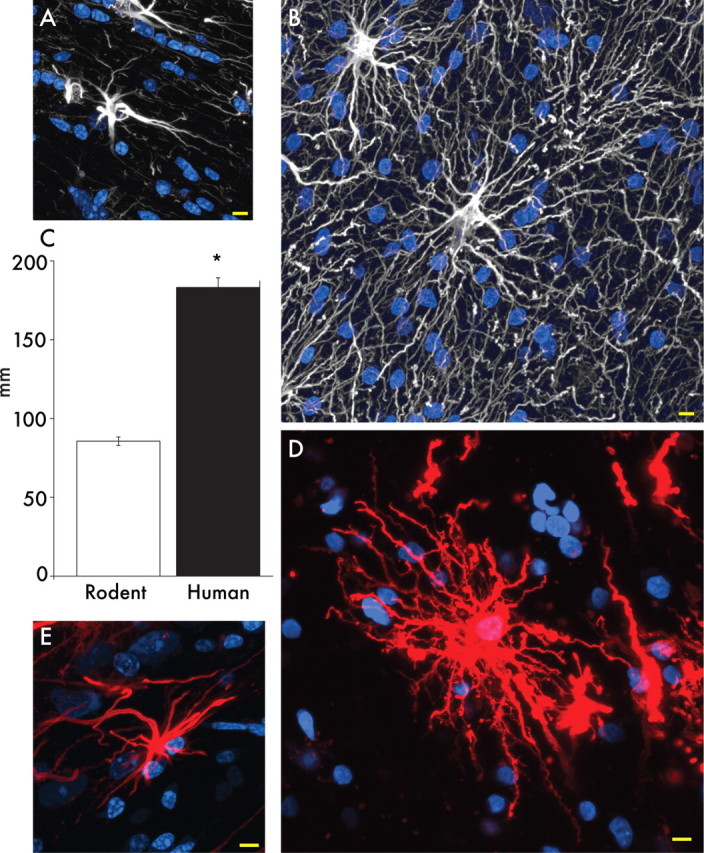
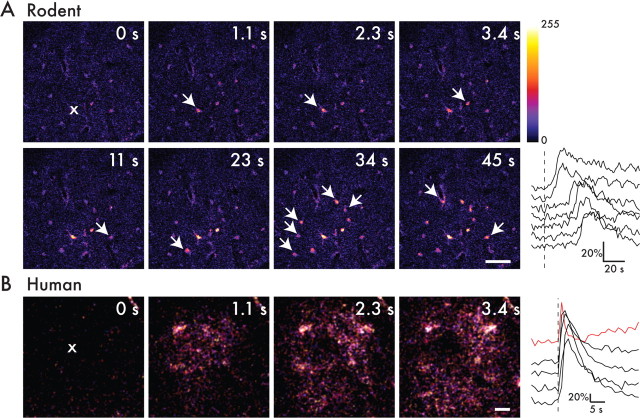
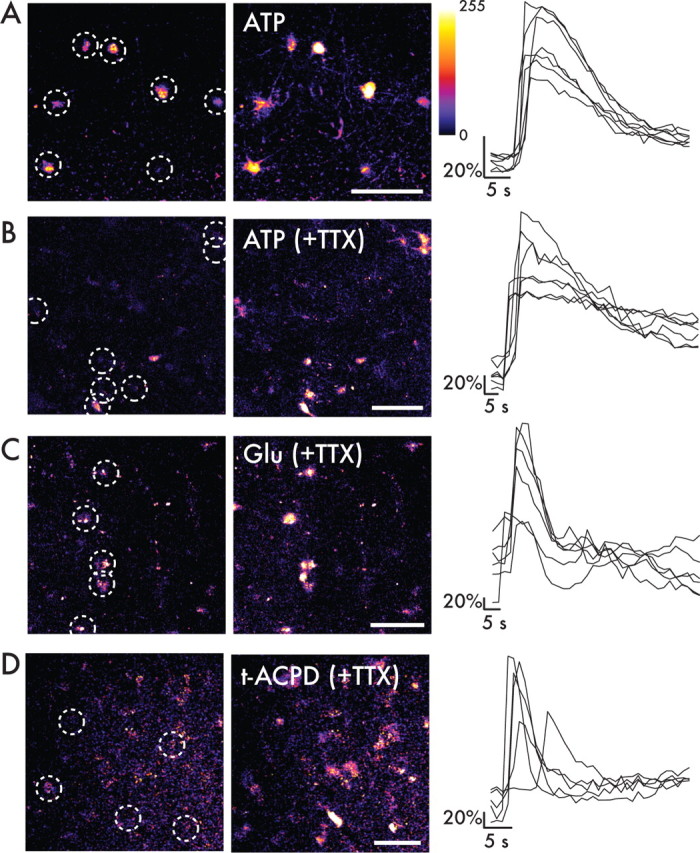
Defining the microanatomic differences between the human brain and that of other mammals is key to understanding its unique computational power. Although much effort has been devoted to comparative studies of neurons, astrocytes have received far less attention. We report here that protoplasmic astrocytes in human neocortex are 2.6-fold larger in diameter and extend 10-fold more GFAP (glial fibrillary acidic protein)-positive primary processes than their rodent counterparts. In cortical slices prepared from acutely resected surgical tissue, protoplasmic astrocytes propagate Ca(2+) waves with a speed of 36 microm/s, approximately fourfold faster than rodent. Human astrocytes also transiently increase cystosolic Ca(2+) in response to glutamatergic and purinergic receptor agonists. The human neocortex also harbors several anatomically defined subclasses of astrocytes not represented in rodents. These include a population of astrocytes that reside in layers 5-6 and extend long fibers characterized by regularly spaced varicosities. Another specialized type of astrocyte, the interlaminar astrocyte, abundantly populates the superficial cortical layers and extends long processes without varicosities to cortical layers 3 and 4. Human fibrous astrocytes resemble their rodent counterpart but are larger in diameter. Thus, human cortical astrocytes are both larger, and structurally both more complex and more diverse, than those of rodents. On this basis, we posit that this astrocytic complexity has permitted the increased functional competence of the adult human brain.


Figures

Figure 1.
Figure 1.
There are four classes of GFAP+ cells in the human cortex. Human brains were immunolabeled with GFAP and analyzed throughout all layers of the cortex to determine subclasses of human astrocytes. Layer 1 is composed of the cell bodies of interlaminar astrocytes, whose processes extend over millimeter lengths through layers 2–4 and are characterized by their tortuous morphology. Protoplasmic astrocytes, the most common, reside in layers 2–6. Polarized astrocytes are found only in humans and are seen sparsely in layers 5–6. They extend millimeter long processes that are characterized by varicosities. Fibrous astrocytes are found in the white matter and contain numerous overlapping processes. Yellow lines indicate areas in which the different classes of astrocytes reside. Scale bar, 150 μm.
Figure 2.
Figure 2.
Varicose projection astrocytes in layers 5 and 6. A, Varicose projection astrocytes reside in layers 5–6 and extend long processes characterized by evenly spaced varicosities. Inset, Varicose projection astrocyte from chimpanzee cortex. GFAP, White; MAP2, red; and DAPI, blue. Yellow arrowheads indicate varicose projections. Scale bar, 50 μm. B, Diolistic labeling (white) of a varicose projection astrocyte whose long process terminates in the neuropil. sytox, Blue. Scale bar, 20 μm. C, High-power image of the yellow box in B highlighting the varicosities seen along the processes. Scale bar, 10 μm. D–F, Individual z-sections of the astrocyte in B demonstrating long processes, straighter fine processes, and association with the vasculature. Yellow dotted lines in F outline position of a blood vessel.
Figure 3.
Figure 3.
Primate-specific interlaminar astrocytes populate layer 1. A, Pial surface and layers 1–2 of human cortex. GFAP, White; DAPI, blue. Scale bar, 100 μm. Yellow line indicates border between layer 1 and 2. B, High-power image of layer 1 showing interlaminar astrocytes. Inset, Cell bodies. GFAP, White; DAPI, blue. Scale bar, 10 μm. C, Interlaminar astrocyte processes characterized by their tortuosity. Scale bar, 10 μm. D, Process from a varicose projection astrocyte. Scale bar, 10 μm. E, Electron micrograph of GFAP immunohistochemistry demonstrates the presence of mitochondria (Mi) within interlaminar fibers.
Figure 4.
Figure 4.
Protoplasmic astrocytes are larger and more complicated than the rodent counterpart. A, Typical mouse protoplasmic astrocyte. GFAP, White. Scale bar, 20 μm. B, Typical human protoplasmic astrocyte in the same scale. Scale bar, 20 μm. C, D, Human protoplasmic astrocytes are 2.55-fold larger and have 10-fold more main GFAP processes than mouse astrocytes (human, n = 50 cells from 7 patients; mouse, n = 65 cells from 6 mice; mean ± SEM; *p < 0.005, t test). E, Mouse protoplasmic astrocyte diolistically labeled with DiI (white) and sytox (blue) revealing the full structure of the astrocyte including its numerous fine processes. Scale bar, 20 μm. F, Human astrocyte diolistically labeled demonstrates the highly complicated network of fine process that defines the human protoplasmic astrocyte. Scale bar, 20 μm. Inset, Human protoplasmic astrocyte diolistically labeled as well as immunolabeled for GFAP (green) demonstrating colocalization. Scale bar, 20 μm.
Figure 5.
Figure 5.
Human astrocytes are organized into domains. A, Cortical mouse astrocytes labeled with DiI (red) and DiD (green) demonstrating the presence of domains. Nuclei (sytox), Blue. Scale bar, 10 μm. B, Human protoplasmic astrocytes labeled with DiI (red) and DiD (green) demonstrating the presence of domains. Scale bar, 10 μm. C, D, Human astrocytes have greater overlap in their domains than rodents. (human, n = 10 cells from 2 patients; mouse, n = 30 cells from 7 mice; mean ± SEM; *p < 0.005, t test). E–H, High-power images of domain boundaries between neighboring mouse astrocytes seen in A. I–L, High-power images of domain boundaries between neighboring human astrocytes seen in B. Green lines represent the borders of the green cells, and red lines represent the borders of the red cells. Area of overlap between cells is delineated in gray. Yellow lines indicate processes that transverse over the border of the adjacent cell.
Figure 6.
Figure 6.
Astrocytic end feet in rodents and humans. A, Cortical blood vessel in rat. GFAP, White; nuclei (DAPI), blue. Scale bar, 20 μm. B, GFAP in end feet forms rosettes on the vessel in the rat. Scale bar, 10 μm. Yellow circles indicate individual end feet. C, Human protoplasmic astrocytes extend processes to the vasculature. Scale bar, 20 μm. D, Yellow box seen in C. GFAP in end feet completely covers the vasculature. Yellow circles indicate individual end feet. Scale bar, 10 μm. E, Transverse section of blood vessel and human astrocyte end feet. Scale bar, 20 μm. F, Electron micrograph of aquaporin 4 immunohistochemistry of the astrocytic end foot on a capillary (Cap.). Note the presence of mitochondria in the end foot of the astrocyte.
Figure 7.
Figure 7.
Human fibrous astrocytes are significantly larger than in rodent. A, Mouse fibrous astrocyte in white matter. GFAP, White; sytox, blue. Scale bar, 10 μm. B, Human fibrous astrocytes in white matter. Scale bar, 10 μm. C, Human fibrous astrocytes are ∼2.14-fold larger in diameter than the rodent counterpart. *p < 0.0001, t test. D, Human fibrous astrocyte labeled with DiI revealing the full structure of the cell. DiI, Red; sytox, blue. Scale bar, 10 μm. E, Mouse fibrous astrocyte labeled with DiI. Scale bar, 10 μm.
Figure 8.
Figure 8.
Human astrocytes can support faster calcium waves. A, Acute slice preparation of mouse cortex was loaded simultaneously with fluo-4 AM as well as NP-EGTA AM caged calcium. A single astrocyte (indicated as ×) was the target of photorelease of caged calcium in the presence of 1 μm TTX. The target cell increased its calcium with uncaging, and, subsequently, other astrocytes in the field also increased their intracellular calcium in a wave manner temporally (white arrows). The graph represents percentage change in fluorescence over time that is indicative of calcium concentrations. As one moves away from the target cell, the time-to-peak of calcium concentration increases, indicating a calcium wave. The target cell as well as other cells in the field returned to baseline calcium levels within seconds. Scale bar, 50 μm. B, Acute slice preparation of human temporal lobe cortex loaded with fluo-4 AM as well as NP-EGTA AM caged calcium. A single target astrocyte (×) underwent photorelease of caged calcium, resulting in a subsequent calcium wave. The graph represents change in fluorescence over time. Scale bar, 10 μm.
Figure 9.
Figure 9.
Human astrocytes in situ have functional purinergic and glutamatergic receptors and respond with increases in intracellular calcium. A, Acute slice preparation of human temporal lobe loaded with calcium indicator dye fluo-4 AM. Astrocytes (white circles) were shown with resting Ca2+ levels. After 100 μm ATP by bath application, astrocytes increased their intracellular calcium in their cell bodies and processes. The graph at right shows the temporal changes of Ca2+ of astrocytes indicated in white circles. B, Human cortical astrocytes retain their sensitivity to 600 μm ATP in the presence of 1 μm TTX. Scale bar, 10 μm. C, Adult human temporal lobe cortex loaded with fluo-4 AM was exposed to 10 mm glutamate (Glu) in the presence of 1 μm TTX by bath application. Astrocytes respond by increasing intracellular calcium and return to baseline calcium levels within seconds. D, Astrocytes respond to bath application of 30 μm t-ACPD in the presence of 1 μm TTX. Scale bar, 10 μm.

Similar articles

Cited by

References

    1. Andriezen WL. The neuroglia elements of the brain. BMJ. 1893;2:227–230. - PMC - PubMed
    1. Benediktsson AM, Schachtele SJ, Green SH, Dailey ME. Ballistic labeling and dynamic imaging of astrocytes in organotypic hippocampal slice cultures. J Neurosci Methods. 2005;141:41–53. - PubMed
    1. Bordey A, Sontheimer H. Properties of human glial cells associated with epileptic seizure foci. Epilepsy Res. 1998;32:286–303. - PubMed
    1. Bushong EA, Martone ME, Jones YZ, Ellisman MH. Protoplasmic astrocytes in CA1 stratum radiatum occupy separate anatomical domains. J Neurosci. 2002;22:183–192. - PMC - PubMed
    1. Chvátal A, Anderová M, Kirchhoff F. Three-dimensional confocal morphometry: a new approach for studying dynamic changes in cell morphology in brain slices. J Anat. 2007;210:671–683. - PMC - PubMed

Publication types

LinkOut - more resources