

Cutaneous lymphoma incidence patterns in the United States: a population-based study of 3884 cases
- PMID: 19279331
- PMCID: PMC2686177
- DOI: 10.1182/blood-2008-10-184168
Cutaneous lymphoma incidence patterns in the United States: a population-based study of 3884 cases
Abstract
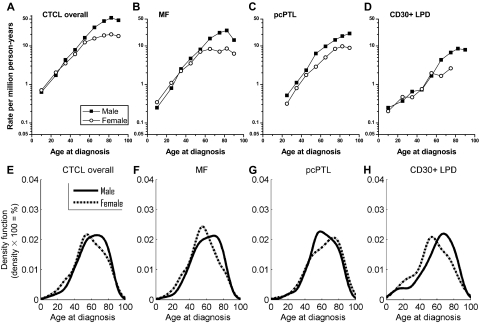
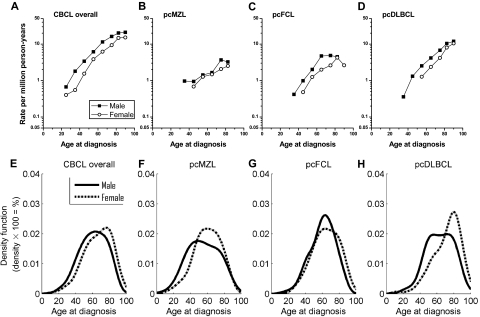
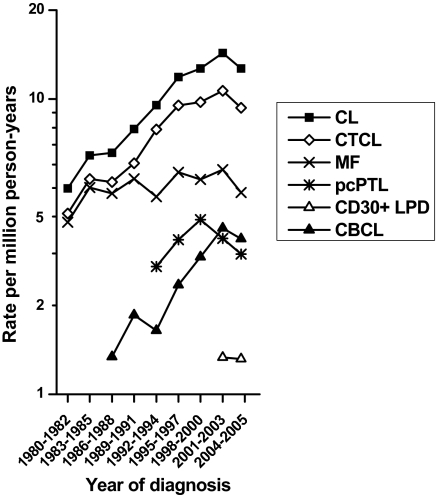
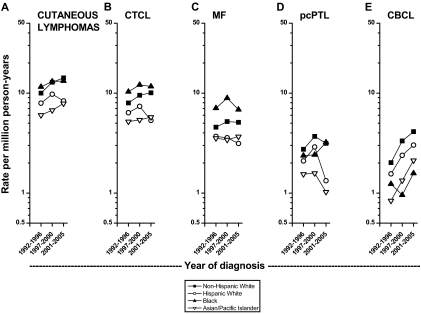
There have been no prior large population-based studies focusing on cutaneous lymphomas (CL) in the United States. Using the Surveillance, Epidemiology and End Results (SEER) program data, we analyzed age-adjusted CL incidence rates (IRs) and survival rates by sex and race/ethnicity. There were 3884 CLs diagnosed during 2001-2005. Cutaneous T-cell lymphomas (CTCLs) accounted for 71% (age-adjusted incidence rate [IR] = 7.7/1 000 000 person-years), whereas cutaneous B-cell lymphomas(CBCLs) accounted for 29% (IR = 3.1/1 000 000 person-years). Males had a statistically significant higher IR of CL than females (14.0 vs 8.2/1 000 000 person-years, respectively; male-female IR ratio [M/F IRR] = 1.72; P < .001). CL IRs were highest among blacks and non-Hispanic whites (both 11.5/1 000 000 person-years), followed by Hispanic whites (7.9) and Asian/Pacific Islanders (7.1). The CTCL IR was highest among blacks (10.0/1 000 000 person-years), whereas the CBCL IR was highest among non-Hispanic whites (3.5). Over the past 25 years, the CL IR increased from 5.0/1 000 000 person-years during 1980-1982 to 14.3 during 2001-2003. During 2004-2005, the CL IR was 12.7. This recent apparent change could be incomplete case ascertainment or potential leveling off of IRs. CLs rates vary markedly by race and sex, supporting the notion that they represent distinct disease entities.
Figures
References
-
- Leboit PE, Burg G, Weedon D, Sarasin A. Lyon, France: IARC Press; 2006. Pathology and Genetics: Skin Tumors.
-
- Riou-Gotta MO, Fournier E, Mermet I, et al. Primary cutaneous lymphomas: a population-based descriptive study of 71 consecutive cases diagnosed between 1980 and 2003. Leuk Lymphoma. 2008;49:1537–1544. - PubMed
-
- Rizvi MA, Evens AM, Tallman MS, Nelson BP, Rosen ST. T-cell non Hodgkin lymphoma. Blood. 2006;107:1255–1264. - PubMed
-
- Criscione VD, Weinstock MA. Incidence of cutaneous T-cell lymphoma in the United States, 1973-2002. Arch Dermatol. 2007;143:854–859. - PubMed
-
- Pimpinelli N, Masala G, Santucci M, et al. Primary cutaneous lymphomas in Florence: a population-based study 1986-2005 [abstract]. Ann Oncol. 1996;7(suppl 3):130.
Publication types
MeSH terms
Grants and funding
LinkOut - more resources
Full Text Sources
Medical
Miscellaneous
