Randomized Controlled Trial
. 2009 Jun;85(6):635-43.
doi: 10.1038/clpt.2009.19. Epub 2009 Mar 11.

Association of nicotine metabolite ratio and CYP2A6 genotype with smoking cessation treatment in African-American light smokers

Affiliations
Randomized Controlled Trial

Association of nicotine metabolite ratio and CYP2A6 genotype with smoking cessation treatment in African-American light smokers

M K Ho et al. Clin Pharmacol Ther. 2009 Jun.

Abstract

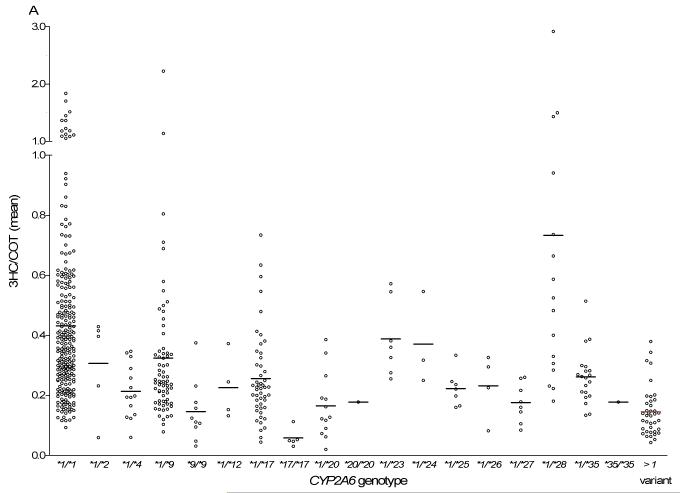
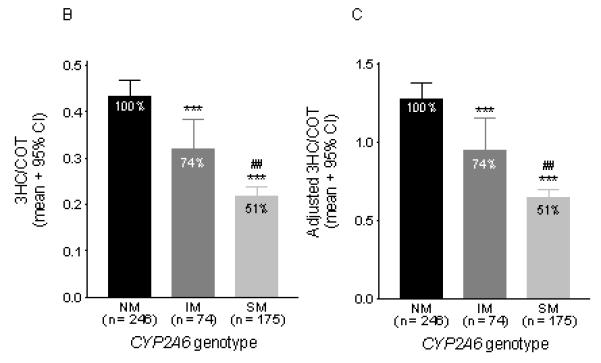
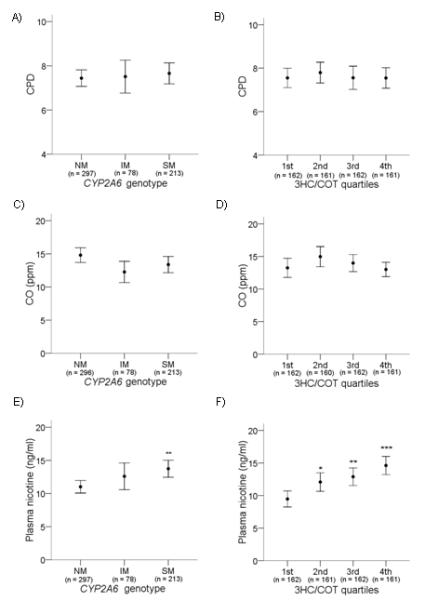
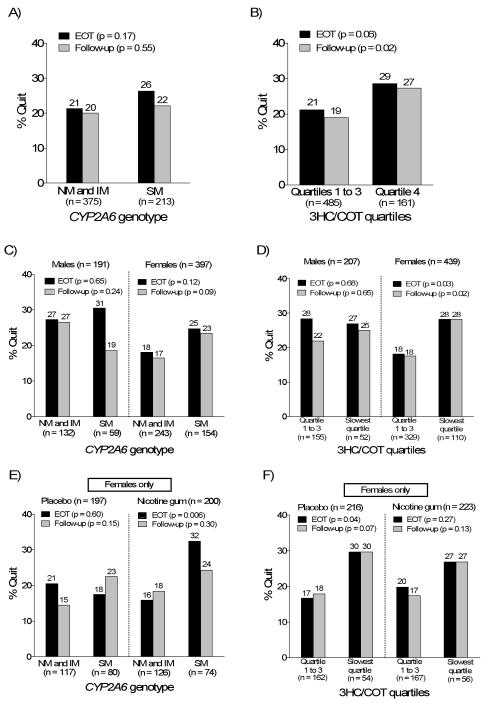
Cytochrome P450 2A6 (CYP2A6) is the main nicotine (NIC)-metabolizing enzyme in humans. We investigated the relationships between CYP2A6 genotype, baseline plasma trans- 3'-hydroxycotinine/cotinine (3HC/COT) (a phenotypic marker of CYP2A6 activity), and smoking behavior in African-American light smokers. Cigarette consumption, age of initiation, and dependence scores did not differ among 3HC/COT quartiles or CYP2A6 genotype groups. Slow metabolizers (SMs; both genetic and phenotypic) had significantly higher plasma NIC levels, suggesting that cigarette consumption was not reduced to adjust for slower rates of NIC metabolism. Individuals in the slowest 3HC/COT quartile had higher quitting rates with both placebo and NIC gum treatments (odds ratio 1.85, 95% confidence interval (CI) 1.08-3.16, P = 0.03). Similarly, the slowest CYP2A6 genotype group had higher quitting rates, although this trend did not reach significance (odds ratio 1.61, 95% CI 0.95-2.72, P = 0.08). The determination of the 3HC/COT ratio, and possibly CYP2A6 genotype, may be useful in the future for personalizing the choice of smoking cessation treatment in African-American light smokers.


Figures

Fig.1
Fig.1
A) CYP2A6 genotypes and their associated unadjusted 3HC/COT ratios. Each dot represents an individual and the line represents the mean 3HC/COT ratio in each genotype group. The CYP2A6*1/*1 group (n = 246) includes individuals with the CYP2A6*1B allele. The >1 variant group represents compound heterozygote individuals (e.g. CYP2A6*4/*17). B) The unadjusted 3HC/COT ratio was significantly associated with CYP2A6 genotype groupings. Statistical analyses were performed on the log-transformed ratio with gender, age and BMI as covariates. It should be noted that since only 18 individuals were predicted to be poor metabolizers (completely lacking CYP2A6 function due to having two copies of loss-of-function alleles), they were combined with those predicted to have 10-50% activity to form the SM group. C) The 3HC/COT ratio was also adjusted by gender as illustrated in our previous papers (22, 36, 50). Adjustments were made by dividing each ratio by the mean value of their respective gender. For example, a male individual with an adjusted ratio greater than one indicates values that are higher than the mean ratio of all males. NM = normal metabolizers, IM = intermediate metabolizers, SM = slow metabolizers. The 3HC/COT when adjusted for the covariates (gender, BMI, and age) found to be significant in this population, using regression analyses, is as follows (mean ± 95%CI): NM = 0.44 ± 0.03, IM = 0.31 ± 0.05, SM = 0.22 ± 0.03). *** p < 0.001 when compared to the NMs. ## p < 0.01 when compared to IMs. The number of individuals are listed on the x – axis.
Fig.1
Fig.1
A) CYP2A6 genotypes and their associated unadjusted 3HC/COT ratios. Each dot represents an individual and the line represents the mean 3HC/COT ratio in each genotype group. The CYP2A6*1/*1 group (n = 246) includes individuals with the CYP2A6*1B allele. The >1 variant group represents compound heterozygote individuals (e.g. CYP2A6*4/*17). B) The unadjusted 3HC/COT ratio was significantly associated with CYP2A6 genotype groupings. Statistical analyses were performed on the log-transformed ratio with gender, age and BMI as covariates. It should be noted that since only 18 individuals were predicted to be poor metabolizers (completely lacking CYP2A6 function due to having two copies of loss-of-function alleles), they were combined with those predicted to have 10-50% activity to form the SM group. C) The 3HC/COT ratio was also adjusted by gender as illustrated in our previous papers (22, 36, 50). Adjustments were made by dividing each ratio by the mean value of their respective gender. For example, a male individual with an adjusted ratio greater than one indicates values that are higher than the mean ratio of all males. NM = normal metabolizers, IM = intermediate metabolizers, SM = slow metabolizers. The 3HC/COT when adjusted for the covariates (gender, BMI, and age) found to be significant in this population, using regression analyses, is as follows (mean ± 95%CI): NM = 0.44 ± 0.03, IM = 0.31 ± 0.05, SM = 0.22 ± 0.03). *** p < 0.001 when compared to the NMs. ## p < 0.01 when compared to IMs. The number of individuals are listed on the x – axis.
Fig. 2
Fig. 2
A, B) CYP2A6 genotype and 3HC/COT were not associated with self-reported CPD. C, D) CYP2A6 genotype and 3HC/COT were not associated with expired CO. E) CYP2A6 genotype was associated with nicotine plasma levels. **p < 0.01 when compared to NMs. F) 3HC/COT was associated with nicotine plasma levels. *p < 0.05, **p < 0.01 and *** p < 0.001 when compared to the 1st quartile. Individuals with 3HC/COT values in the 1st quartile have the fastest CYP2A6 activity, while those in the 4th quartile have the slowest CYP2A6 activity. Data are presented as mean ± 95% confidence interval. The number of individuals are listed on the x – axis.
Fig. 3
Fig. 3
A, B) Association of CYP2A6 genotype and 3HC/COT quartiles with CO-verified quit rates at EOT and follow-up. The NMs and IMs were pooled for analyses and compared to SMs. Individuals with highest 3HC/COT ratios in quartiles 1st to 3rd were pooled for analyses, and compared to individuals with 3HC/COT ratios in the lowest 25th percentile (4th quartile). C, D) Association of CYP2A6 genotype and 3HC/COT quartiles with CO-verified quit rates at EOT and follow-up by gender. E, F) Association of CYP2A6 genotype and 3HC/COT quartiles with CO-verified quit rates at EOT and follow-up by treatment arm. Only data in females is shown for fig. 3E and F. The p-values listed were derived from univariate analyses of quit rates by categories of CYP2A6 activities; the results from the multivariate analysis is presented in Table 4.

References

    1. Kandel DB, Chen K. Extent of smoking and nicotine dependence in the United States: 1991-1993. Nicotine & Tobacco Research. 2000;2(3):263–274. - PubMed
    1. Royce JM, Hymowitz N, Corbett K, Hartwell TD, Orlandi MA. Smoking cessation factors among African Americans and whites. COMMIT Research Group. Am J Public Health. 1993;83(2):220–226. - PMC - PubMed
    1. Centers for Disease Control and Prevention Smoking Cessation During Previous Year Among Adults -- United States, 1990 and 1991. Morbidity and Mortality Weekly Report. 1993:504–507. - PubMed
    1. Centers for Disease Control and Prevention . In: Tobacco use among U.S. racial/ethnic minority groups — African-Americans, American-Indians and Alaska Natives, Asian-Americans and Pacific Islanders, and Hispanics: a report of the Surgeon General. Department of Health and Human Services, editor. Atlanta: 1998. - PubMed
    1. Haiman CA, Stram DO, Wilkens LR, Pike MC, Kolonel LN, Henderson BE, et al. Ethnic and Racial Differences in the Smoking-Related Risk of Lung Cancer. N Engl J Med. 2006;354(4):333–342. - PubMed

Publication types