. 2009 Apr 22;28(8):1067-77.
doi: 10.1038/emboj.2009.56. Epub 2009 Mar 12.

Spt6 enhances the elongation rate of RNA polymerase II in vivo

Affiliations

Spt6 enhances the elongation rate of RNA polymerase II in vivo

M Behfar Ardehali et al. EMBO J. .

Abstract

Several eukaryotic transcription factors have been shown to modulate the elongation rate of RNA polymerase II (Pol II) on naked or chromatin-reconstituted templates in vitro. However, none of the tested factors have been shown to directly affect the elongation rate of Pol II in vivo. We performed a directed RNAi knock-down (KD) screen targeting 141 candidate transcription factors and identified multiple factors, including Spt6, that alter the induced Hsp70 transcript levels in Drosophila S2 cells. Spt6 is known to interact with both nucleosome structure and Pol II, and it has properties consistent with having a role in elongation. Here, ChIP assays of the first wave of Pol II after heat shock in S2 cells show that KD of Spt6 reduces the rate of Pol II elongation. Also, fluorescence recovery after photobleaching assays of GFP-Pol II in salivary gland cells show that this Spt6-dependent effect on elongation rate persists during steady-state-induced transcription, reducing the elongation rate from approximately 1100 to 500 bp/min. Furthermore, RNAi depletion of Spt6 reveals its broad requirement during different stages of development.


Figures
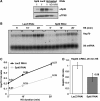
Figure 1
Figure 1
Spt6 RNAi decreases the accumulation of Hsp70 and Hsp83 mRNA upon induction. (A) Immunoblot on lysates from LacZ (mock treatment) and Spt6 RNAi-treated cells with Spt6 and TFIIS (loading control) antibodies. 1 corresponds to 4.0 × 10⁵ cells. Serial dilution of the untreated extract was also loaded to quantify the efficiency of RNAi KD. (B) Time course analysis of Hsp70 mRNA accumulation in RNAi-treated samples. Cells were heat shocked for the indicated time. The level of Hsp70 transcript was analysed by northern blot. Pol III-transcribed U6 snRNA was used as an internal standard for normalization (each set represents three biological replicates). (C) Graph depicts the normalized values of Hsp70 transcripts (error bars represent s.e.m.). (D) Levels of Hsp83 mRNA accumulation after a 20-min HS induction as examined by northern blot analysis (error bars show standard deviation).
Figure 2
Figure 2
Depletion of Spt6 reduces the elongation rate of RNA polymerase II immediately after HS induction. ChIP results showing association of Spt6 (A) with different regions of the Hsp70 transcript in both Spt6 and LacZ RNAi-treated samples. Time course analysis of Pol II (α-Rpb3) density and distribution at Hsp70 by 2 min (B), 6 min (C), 18 min (D) after HS induction in Spt6 and LacZ RNAi samples. Numbers below each bar represents the position of real-time PCR primers relative to the Hsp70 transcription start site, as depicted at the bottom of panel A. For each RNAi treatment and time point, percent inputs were normalized to the respective +946 region. (E) Pol II occupancy on the body of Hsp83 at different time points after HS induction. The grey box downstream of the +62 primer denotes the relative position of Hsp83 intron. For all experiments error bars denote s.e.m. of at least three biological replicates. The intergenic background primer pair targets a region 32 kb downstream of the last Hsp70 gene at the 87C genomic loci.
Figure 3
Figure 3
FRAP analysis of Pol II at 87A; 87C HS loci upon full HS activation in Spt6 RNAi and control animals. (A) Western blot analysis showing general KD of Spt6 in the third instar larvae of actin5C-GAL4/UAS-Spt6RNAi (RNAi+) and TM6/UAS-Spt6RNAi (RNAi−). TFIIS staining served as a loading control. Dilution of the lysates was also loaded to quantify the KD efficiency. (B) KD of Spt6 in the salivary glands of Spt6RNAi animals was assessed by examining the fluorescent intensity, resulting from expression of UAS-YFP-Spt6 insert in YFP-Spt6/+; 6983-GAL4/+ (RNAi−) or YFP-Spt6/+; 6983-GAL4/UAS-Spt6RNAi (RNAi+) lines. (C) Images of EGFP-Rpb3 at HS loci after full gene activation in control (upper panel) or RNAi+ glands (bottom panel) before and after photobleaching. Time after the start of photobleaching is shown on the upper corner of each image in seconds. Genotypes are UAS-EGFP-Rpb3/CyO; 6983-GAL4/Ubx (RNAi−) and UAS-EGFP-Rpb3/+; 6983-GAL4/UAS-Spt6RNAi (RNAi+). (D) Normalized fluorescence intensity plots of the FRAP analysis for the 87A and 87C loci in control (green) and Spt6 RNAi (red) samples. Green and red lines denote the points from which t1/2 is derived.
Figure 4
Figure 4
H3-K36 trimethylation does not positively stimulate the elongation rate of Pol II at Hsp70. (A) ChIP experiment showing the density of histone H3 throughout the body of Hsp70 18 min after HS induction in LacZ (white) and Spt6 (gray) RNAi-treated cells (n⩾3, error bars denote s.e.m.). (B) H3-K36 trimethylation levels at different regions of Hsp70 18 min after HS were normalized to histone H3 density at the respective regions in LacZ (white) and Spt6 (gray) RNAi samples (n=3, error bars denote s.e.m.). (C) Western blot analysis on lysates from LacZ, Spt6 and dHypb RNAi-treated cells. Samples were probed for H3-K36 trimethylation mark. TFIIS antibody was used as a loading control. (D) ChIP analysis showing the first wave of Pol II molecules traversing through Hsp70 2 min after HS induction in LacZ (white), dHypb (gray) and Spt6 (dark gray) RNAi-treated cells (n=2 for LacZ and dHypb, error bars denote range; n=1 for Spt6). Spt6 RNAi was included as a positive control for elongation rate defects. Results from this single experiment are consistent with what we have described in Figure 2B.
Figure 5
Figure 5
Spt6 is critical for normal transcription termination and maximal recruitment of Paf1, Rtf1 and Spt5 to the Hsp70 gene. (A) Rpb3 (Pol II) density upstream (+2210) and downstream (+2668) of the polyadenylation signal in Spt6 and LacZ RNAi samples 18 min after HS induction (n=4, error bars denote s.e.m.). The black box between the two primer pair regions represents the relative position of the polyadenylation signal. (B) Same experiment as in A showing the Hsp83 gene (n=3, error bars denote s.e.m.). (CF) Association of TFIIS (C), Paf1 (D), Rtf1 (E) and Spt5 (F) with different regions of the Hsp70 gene 18 min after full HS activation. The values on x-axis show the centre of primer pairs used in the real-time PCR experiment. The y-axis refers to the percent inputs values for each factor normalized to the level of Pol II (Rpb3) present at the same region (error bars denote s.e.m. of three independent experiments). (G) Cellular levels of each of the indicated proteins in Spt6, LacZ RNAi treated and untreated samples. Other RNAi treatments were included to show the specificity of antibody for each experiment.
Figure 6
Figure 6
Spt6 is critical for normal fly development throughout the lifecycle. (A) A chart depicting requirement of Spt6 during different stages of development. Results from Peter et al (2002) revealed that P-element insertion at the Spt6 gene leads to lethality at the embryonic stage. Determined by driving expression of UAS-Spt6RNAi with the robustly and ubiquitously expressed Tubulin-GAL4 driver line. Y–Crossing the UAS-Spt6RNAi to the 6983-GAL4 line, which has a broad expression pattern during the pupal stage causes lethality as pharate adults. (B) Expression of UAS-Spt6RNAi dsRNA during the pupal stage by the 6983-GAL4 driver results in lethality as pharate adults with aberrant abdominal development. Notably defects in cuticle deposition, hair development at around 80 h after puparium formation (APF). (C) Same as in B, but at later developmental stage before eclosion (about 96 APF). What appear to be melanotic lesions were also visible in the abdominal region of the Spt6 RNAi animals at a high frequency.

Similar articles

Cited by

References

    1. Adelman K, Marr MT, Werner J, Saunders A, Ni Z, Andrulis ED, Lis JT (2005) Efficient release from promoter-proximal stall sites requires transcript cleavage factor TFIIS. Mol Cell 17: 103–112 - PubMed
    1. Adelman K, Wei W, Ardehali MB, Werner J, Zhu B, Reinberg D, Lis JT (2006) Drosophila Paf1 modulates chromatin structure at actively transcribed genes. Mol Cell Biol 26: 250–260 - PMC - PubMed
    1. Adkins MW, Tyler JK (2006) Transcriptional activators are dispensable for transcription in the absence of Spt6-mediated chromatin reassembly of promoter regions. Mol Cell 21: 405–416 - PubMed
    1. Andrulis ED, Guzman E, Doring P, Werner J, Lis JT (2000) High-resolution localization of Drosophila Spt5 and Spt6 at heat shock genes in vivo: roles in promoter proximal pausing and transcription elongation. Genes Dev 14: 2635–2649 - PMC - PubMed
    1. Andrulis ED, Werner J, Nazarian A, Erdjument-Bromage H, Tempst P, Lis JT (2002) The RNA processing exosome is linked to elongating RNA polymerase II in Drosophila. Nature 420: 837–841 - PubMed

Publication types

MeSH terms