. 2009;4(3):e4835.
doi: 10.1371/journal.pone.0004835. Epub 2009 Mar 12.

Graveyards on the move: the spatio-temporal distribution of dead ophiocordyceps-infected ants

Affiliations

Graveyards on the move: the spatio-temporal distribution of dead ophiocordyceps-infected ants

Maj-Britt Pontoppidan et al. PLoS One. 2009.

Abstract

Parasites are likely to play an important role in structuring host populations. Many adaptively manipulate host behaviour, so that the extended phenotypes of these parasites and their distributions in space and time are potentially important ecological variables. The fungus Ophiocordyceps unilateralis, which is pan-tropical in distribution, causes infected worker ants to leave their nest and die under leaves in the understory of tropical rainforests. Working in a forest dynamic plot in Southern Thailand we mapped the occurrence of these dead ants by examining every leaf in 1,360 m(2) of primary rainforest. We established that high density aggregations exist (up to 26 dead ants/m(2)), which we coined graveyards. We further established that graveyards are patchily distributed in a landscape with no or very few O. unilateralis-killed ants. At some, but not all, spatial scales of analysis the density of dead ants correlated with temperature, humidity and vegetation cover. Remarkably, having found 2243 dead ants inside graveyards we only found 2 live ants of the principal host, ant Camponotus leonardi, suggesting that foraging host ants actively avoid graveyards. We discovered that the principal host ant builds nests in high canopy and its trails only occasionally descend to the forest floor where infection occurs. We advance the hypothesis that rare descents may be a function of limited canopy access to tree crowns and that resource profitability of such trees is potentially traded off against the risk of losing workers due to infection when forest floor trails are the only access routes. Our work underscores the need for an integrative approach that recognises multiple facets of parasitism, such as their extended phenotypes.


Conflict of interest statement

Competing Interests: The authors have declared that no competing interests exist.

Figures

Figure 1
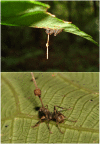
Figure 1. Dead ants infected with Ophiocordyceps unilateralis.
Ants biting the underside of leaves as a result of infection by O. unilateralis. The top panel shows the whole leaf with the dense surrounding vegetation in the background and the lower panel shows a close up view of dead ant attached to a leaf vein. The stroma of the fungus emerges from the back of the ant's head and the perithecia, from which spores are produced, grows from one side of this stroma, hence the species epithet. The photograph has been rotated 180 degrees to aid visualization.
Figure 2
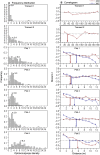
Figure 2. Density frequency distributions and Moran's I correlograms.
a. Density frequency distributions for the five plots and the two transect in 2006. Mean Ophiocordyceps density is indicated with an arrow. b. Moran's I values plotted against distance classes for 2006 (blue) and 2007 (red). Positive I values indicate a positive autocorrelation while I values around zero indicate absence of autocorrelation. Arrows show the distances where the curves intercept the zero-line, an intercept that estimates the average patch diameter.
Figure 3
Figure 3. Red/Blue plots of the sampling plots.
a. Schematic maps of the five 10×10 m sampling plots. Trees are shown in dark brown and paths in light brown. Black dots indicate cell densities of dead O. unilateralis infected ants (each dot is a single ant). Colour codes represent the vegetation cover of the cells, ranging from 0 (lightest green) to 5 (darkest green). b. Red/blue plot showing source cells in red and sink cells in blue in 2006. c. Red/blue plot showing source cells in red and sink cells in blue in 2007.
Figure 4
Figure 4. Temporal changes in Ophiocordyceps densities.
Mean Ophiocordyceps densities for high density areas (red) and low density areas (blue) in each of the five plots from September 2006 until September 2007.
Figure 5
Figure 5. 3-D habitat of the host ant Camponotus leonardi.
A stylised representation of the 3-D habitat of the C. leonardi host ants, which includes both the high canopy and the understory. The normal foraging range of nests is shown by the orange shapes that represent focal nest sites and foraging areas, with the black lines representing trails across the canopy and onto the forest floor. The approximately 2-D habitat of the Ophiocordyceps killed ants in illustrated by the darker green ellipses representing graveyards. The aggregated distribution within graveyards has also been indicated.

References

    1. Wolfe ND, Dunavan CP, Diamond J. Origins of major human infectious diseases. Nature. 2007;447:279–283. - PMC - PubMed
    1. Woolhouse M, Donaldson A. Managing foot-and-mouth - The science of controlling disease outbreaks. Nature. 2001;410:515–516. - PubMed
    1. Moore J. Parasites and the behavior of animals. Oxford University Press; 2002.
    1. Dawkins R. The extended phenotype. Oxford University Press; 1982.
    1. Maeyama T, Terayama M, Matsumoto T. The abnormal-behavior of Colobopsis sp (Hymenoptera, Formicidae) parasitized by Mermis (nematoda) in Papua-New-Guinea. Sociobiology. 1994;24:115–119.