. 2009 Apr 1;46(7):928-38.
doi: 10.1016/j.freeradbiomed.2009.01.003.

Ethanol and tobacco smoke increase hepatic steatosis and hypoxia in the hypercholesterolemic apoE(-/-) mouse: implications for a "multihit" hypothesis of fatty liver disease

Affiliations

Ethanol and tobacco smoke increase hepatic steatosis and hypoxia in the hypercholesterolemic apoE(-/-) mouse: implications for a "multihit" hypothesis of fatty liver disease

Shannon M Bailey et al. Free Radic Biol Med. .

Abstract

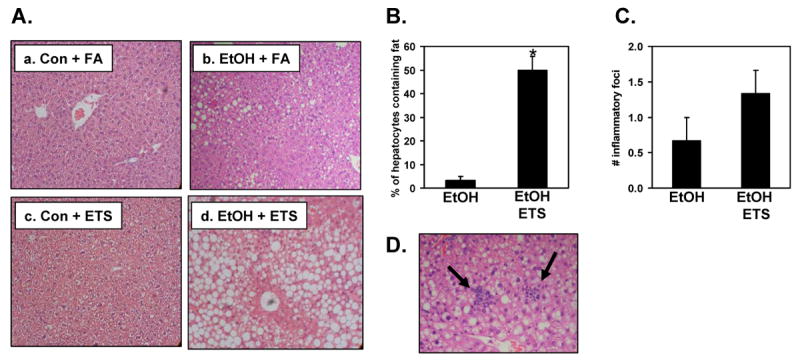
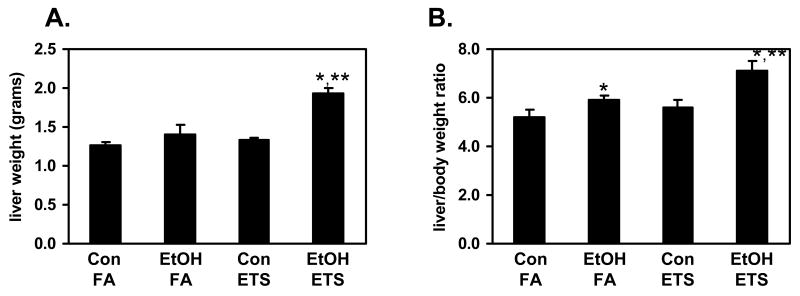
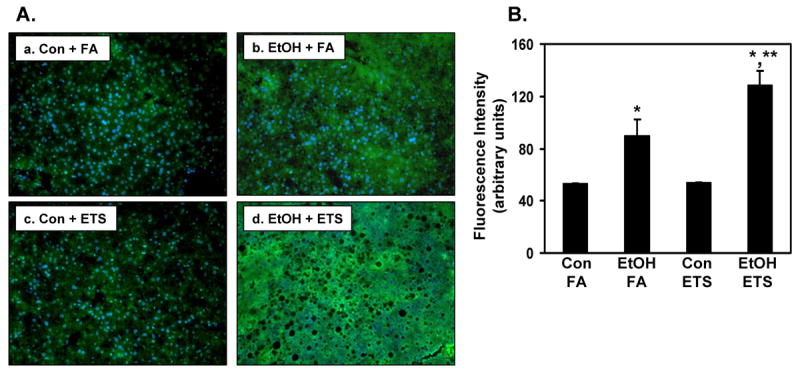
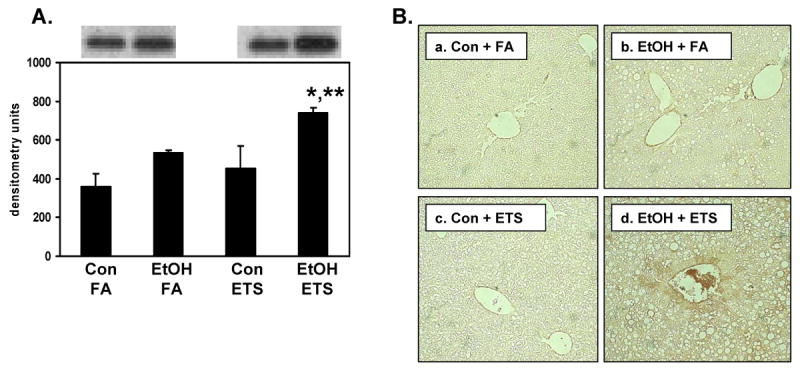
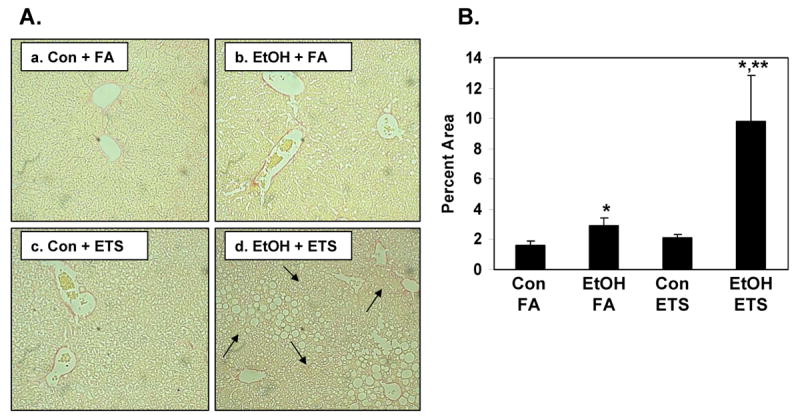
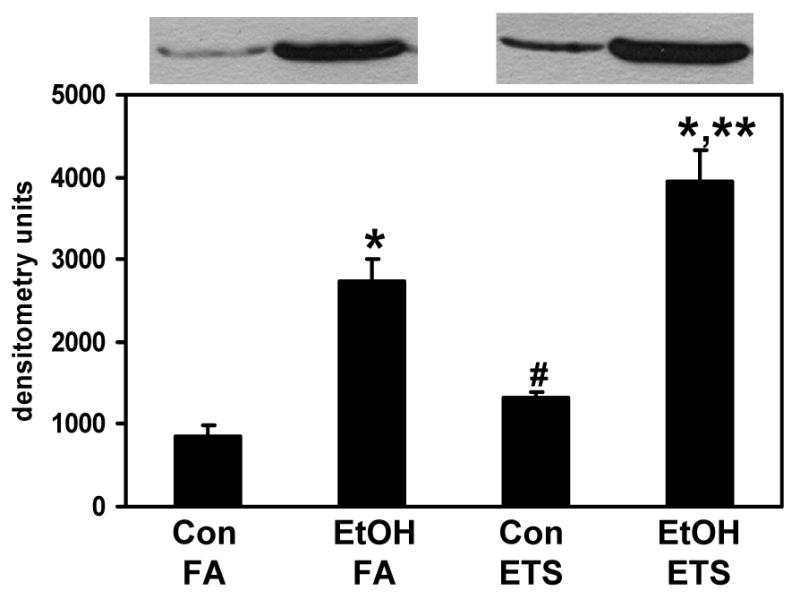
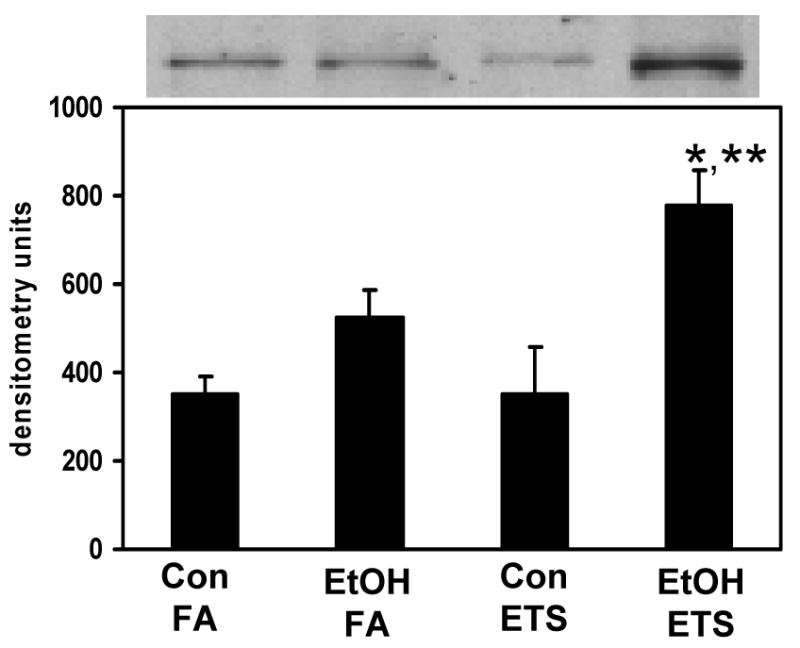
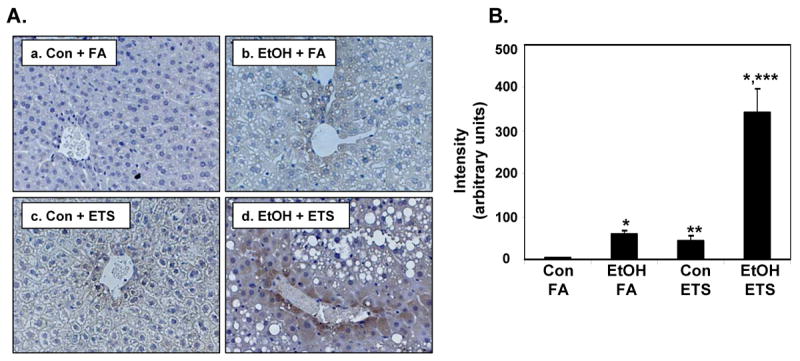
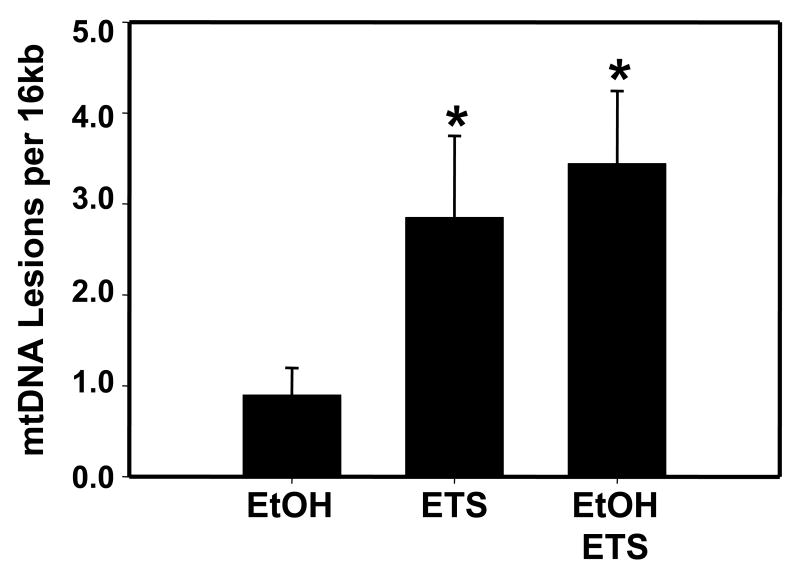
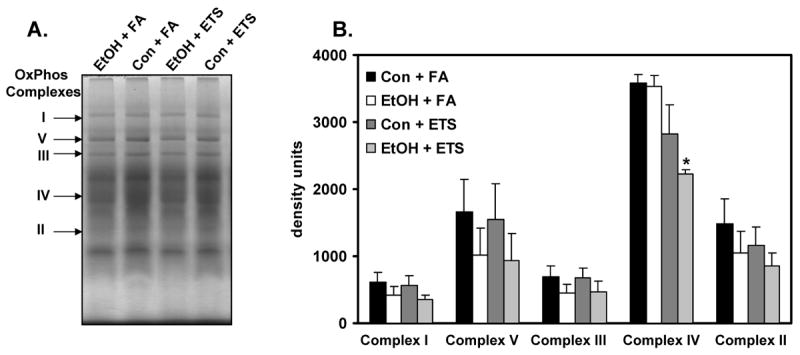
Although epidemiologic studies indicate that combined exposure to cigarette smoke and alcohol increase the risk and severity of liver diseases, the molecular mechanisms responsible for hepatotoxicity are unknown. Similarly, emerging evidence indicates a linkage among hepatic steatosis and cardiovascular disease. Herein, we hypothesize that combined exposure to alcohol and environmental tobacco smoke (ETS) on a hypercholesterolemic background increases liver injury through oxidative/nitrative stress, hypoxia, and mitochondrial damage. To test this, male apoE(-/-) mice were exposed to an ethanol-containing diet, ETS alone, or a combination of the two, and histology and functional endpoints were compared to filtered-air-exposed, ethanol-naïve controls.Whereas ethanol consumption induced a mild steatosis, combined exposure to ethanol + ETS resulted in increased hepatic steatosis, inflammation, alpha-smooth muscle actin, and collagen. Exposure to ethanol + ETS induced the largest increase in CYP2E1 and iNOS protein, as well as increased 3-nitrotyrosine, mtDNA damage, and decreased cytochrome c oxidase protein, compared to all other groups. Similarly, the largest increase in HIF1alpha expression was observed in the ethanol + ETS group, indicating enhanced hypoxia. These studies demonstrate that ETS increases alcohol-dependent steatosis and hypoxic stress. Therefore, ETS may be a key environmental "hit" that accelerates and exacerbates alcoholic liver disease in hypercholesterolemic apoE(-/-) mice.


Figures

Fig. 1
Fig. 1. ETS increases ethanol dependent steatosis and inflammation
Liver was fixed in 10% buffered formalin, embedded in paraffin, sectioned, and stained with hematoxylin-eosin. Panel A, Livers from mice fed control diets (Con) exposed to filtered air (FA) (a) or ETS (c) show no pathological changes or fat deposition in hepatocytes. Mice fed an ethanol-containing diet (EtOH) and exposed to filtered air (b) show mild steatosis, whereas ethanol-fed mice exposed to ETS (d) have severe steatosis. Magnification is 100X. Panel B, Quantification of steatosis. Panel C, Quantification of inflammatory foci. Panel D, Photomicrograph showing aggregates of neutrophils and lymphocytes within liver parenchyma of ethanol + ETS group (arrows). Magnification is 200X.
Fig. 2
Fig. 2. ETS significantly enhances the ethanol dependent increase in liver weight and liver/bodyweight ratio
Mice were pair-fed control (Con) and ethanol (EtOH)-containing diets for 6 weeks while being exposed to filtered air (FA) or ETS (10 mg TSP/m3) for the last 4 weeks of the study. ETS exposure significantly increased the liver weight and liver/body weight ratio in ethanol-fed mice. Data represent the mean ± SEM for 6 mice per group. *p<0.05, compared to corresponding control; **p<0.05, compared to ethanol + filtered air. For liver weight; two-factor ANOVA, ethanol, p=0.0008; ETS, p=0.0023; ethanol × ETS, p=0.017. For liver/body weight ratio; two-factor ANOVA, ethanol, p=0.016; ETS, p=0.042; ethanol × ETS, 0.27.
Fig. 3
Fig. 3. ETS enhances ethanol-dependent hypoxia in liver
Immunofluorescence was performed on formalin fixed liver tissue using HIF1α antiserum (green) and nuclei were counterstained with DAPI (blue). No statistical difference in HIF1α levels was observed between control groups (Con + FA, panel a and Con + ETS, panel c), whereas there was a significant increase in HIF1α staining in the ethanol + filtered air group (EtOH + FA, panel b) compared to corresponding control. This increase in HIF1α was amplified in the ethanol + ETS group (panel d) with widespread HIF1α expression in liver. Panel B shows quantification with *p<0.05, compared to corresponding controls, and **p<0.05, compared to ethanol + filtered air. Two-factor ANOVA, ethanol, p=0.00013; ETS, p=0.043; ethanol × ETS, p=0.048. Data represent the mean ± SEM for n=3 pairs per group. Magnification is 100X.
Fig. 4
Fig. 4. Induction of alpha smooth muscle actin by ethanol and ETS in liver
Panel A, Liver homogenates were subjected to SDS-PAGE and immunoblotting for quantification of alpha smooth muscle actin protein. The top panel in 4A shows representative immunoblots from one pair of control (Con) and ethanol (EtOH)-fed mice exposed to either filtered air (FA) or ETS. The bottom panel in 4A represents the quantification of alpha smooth muscle actin protein in immunoblots. Panel B, Immunohistochemistry was also performed on formalin fixed tissue and representative photomicrographs from each treatment group are shown: a, Con + FA; b, EtOH + FA; c, Con + ETS; and d, EtOH + ETS. Increased brown staining for alpha smooth muscle actin was observed in the EtOH + ETS group (d) compared to other treatment groups. Data represent the mean ± SEM for n=3 pairs per group. Immunoblot statistics - *p<0.05, compared to corresponding control; **p<0.05, compared to ethanol + filtered air. Two-factor ANOVA; ethanol, p=0.011; ETS, p=0.067; ethanol × ETS, p=0.46. Immunohistochemistry data and statistics – Con + FA, 5.4 ± 0.15; EtOH + FA, 11.4 ± 0.9; Con + ETS, 5.7 ± 0.4; and EtOH + ETS, 16.0 ± 1.9 arbitrary intensity units. Two factor ANOVA; ethanol, p<0.001; ETS, p=0.049; ethanol × ETS, p=0.08. Magnification is 200X.
Fig. 5
Fig. 5. Increased collagen fibers by ethanol and ETS in liver
Liver sections were stained with Sirius red and analyzed to detect and quantify collagen. Panel A, There was increased Sirius red staining in EtOH + FA group (b) compared to control diet alone (a). Increased Sirius red staining was observed in the EtOH + ETS group (d) with increased collagen detected around the central veins that radiated out into the parenchyma (arrows, panel d). Panel B, Image analysis (percent area) demonstrated increased Sirius red staining in liver from EtOH + ETS group compared to all other groups. Data represent the mean ± SEM for 3 pairs of mice. Magnification is 200X. *p<0.05, compared to each corresponding control; **p<0.05, compared to ethanol + filtered air. Two-factor ANOVA; ethanol, p=0.019; ETS, p=0.044; ethanol × ETS, 0.074.
Fig. 6
Fig. 6. Combined exposure to ethanol and ETS significantly increases hepatic levels of CYP2E1 protein
Liver homogenates were subjected to SDS-PAGE and immunoblotting for quantification of CYP2E1 protein. Top panel shows representative immunoblots from one pair of control (Con) and ethanol (EtOH)-fed mice exposed to either filtered air (FA) or ETS. Bottom panel represents the quantification of CYP2E1 protein. Data represent the mean ± SEM for n=3 pairs per group. *p<0.05, compared to corresponding control; **p<0.05, compared to ethanol + filtered air; #p<0.05, compared to control + filtered air. Two-factor ANOVA; ethanol, p<0.0001; ETS, p=0.008; ethanol × ETS, 0.17.
Fig. 7
Fig. 7. Exposure to ethanol and ETS significantly increases hepatic levels of iNOS
Liver homogenates were subjected to SDS-PAGE and immunoblotting for quantification of iNOS protein. Top panel shows representative immunoblots from one pair of control (Con) and ethanol (EtOH)-fed mice exposed to either filtered air (FA) or ETS. Bottom panel represents the quantification of iNOS. Data represent the mean ± SEM for n=3 pairs per group. *p<0.05, compared to corresponding control; **p<0.05, compared to ethanol + filtered air. Two-factor ANOVA; ethanol, p=0.002; ETS, p=0.13; ethanol × ETS, p=0.12.
Fig. 8
Fig. 8. Hepatic levels of 3-NT are increased by exposure to ethanol and ETS
Immunohistochemistry was performed on formalin fixed tissues using 3-NT antiserum (brown) against a hemtoxylin nuclear counterstain (blue) in liver sections of control (Con) and ethanol (EtOH)-fed mice exposed to either filtered air (FA) or ETS. Panel A, There was increased 3-NT in control + ETS group (c) and the EtOH + FA group (b) compared to control diet alone (a). Increased 3-NT was observed in the EtOH + ETS group (d) with intense staining for 3-NT around the central veins. Panel B, Image analysis demonstrated increased intensity of 3-NT in liver from EtOH + ETS group compared to all other groups. Data represent the mean ± SEM for 3 pairs of mice. Magnification is 200X. *p<0.05, compared to each corresponding control; **p<0.05, compared to control + filtered air; ***p<0.05, compared to ethanol + filtered air. Two-factor ANOVA; ethanol, ETS, and ethanol × ETS, p<0.0001, ethanol, ETS.
Fig. 9
Fig. 9. Liver mitochondrial DNA damage is increased by ethanol and ETS
Genomic DNA was prepared from livers and mtDNA damage was assessed using QPCR. Data presented in the bar graph indicate the relative amount of mtDNA damage (lesions per 16 kb) in liver from ethanol-fed (EtOH), ETS exposed, and EtOH + ETS animals compared with their corresponding controls. Controls are set at zero lesions per 16kb. Data represent the mean ± SEM for n=3 pairs animals per group, *p<0.05, compared to corresponding control.
Fig. 10
Fig. 10. Ethanol and ETS decrease cytochrome c oxidase in liver
Representative BN-PAGE gels of mitochondria from control + filtered (Con + FA), ethanol + filtered air (EtOH + FA), control + ETS (Con + ETS), and ethanol + ETS (EtOH + ETS) are shown in panel A. For these gels, 250 μg of mitochondrial protein was loaded onto non-denaturing 5-15% gradient gels to separate the oxidative phosphorylation complexes intact and in native form. The complexes are labeled by the arrows. Panel B presents a comparison of the relative densities (i.e. quantities) of complexes I, V, III, IV, and II from each of the 4 treatment groups. Data represent the mean ± SEM for 3 pairs per group. *p=0.022, compared to ethanol + filtered air group. Two-factor ANOVA, ethanol, p=0.55; ETS, p=0.015; ethanol × ETS, p=0.66.

References

    1. Mantena SK, King AL, Andringa KK, Landar A, Darley-Usmar V, Bailey SM. Novel interactions of mitochondria and reactive oxygen/nitrogen species in alcohol mediated liver diseases. World J Gastroenterol. 2007;13:4967–4973. - PMC - PubMed
    1. Thakur V, McMullen MR, Pritchard MT, Nagy LE. Regulation of macrophage activation in alcoholic liver disease. J Gastroenterol Hepatol. 2007;22 1:S53–56. - PubMed
    1. Han DW. Intestinal endotoxemia as a pathogenetic mechanism in liver failure. World J Gastroenterol. 2002;8:961–965. - PMC - PubMed
    1. Hines IN, Wheeler MD. Recent advances in alcoholic liver disease III. Role of the innate immune response in alcoholic hepatitis. Am J Physiol Gastrointest Liver Physiol. 2004;287:G310–314. - PubMed
    1. Bailey SM. A review of the role of reactive oxygen and nitrogen species in alcohol-induced mitochondrial dysfunction. Free Radic Res. 2003;37:585–596. - PubMed

Publication types

MeSH terms

LinkOut - more resources