. 2009 Apr 2;113(13):4413-24.
doi: 10.1021/jp8087868.

Hybrid coarse-graining approach for lipid bilayers at large length and time scales

Affiliations

Hybrid coarse-graining approach for lipid bilayers at large length and time scales

Gary S Ayton et al. J Phys Chem B. .

Abstract

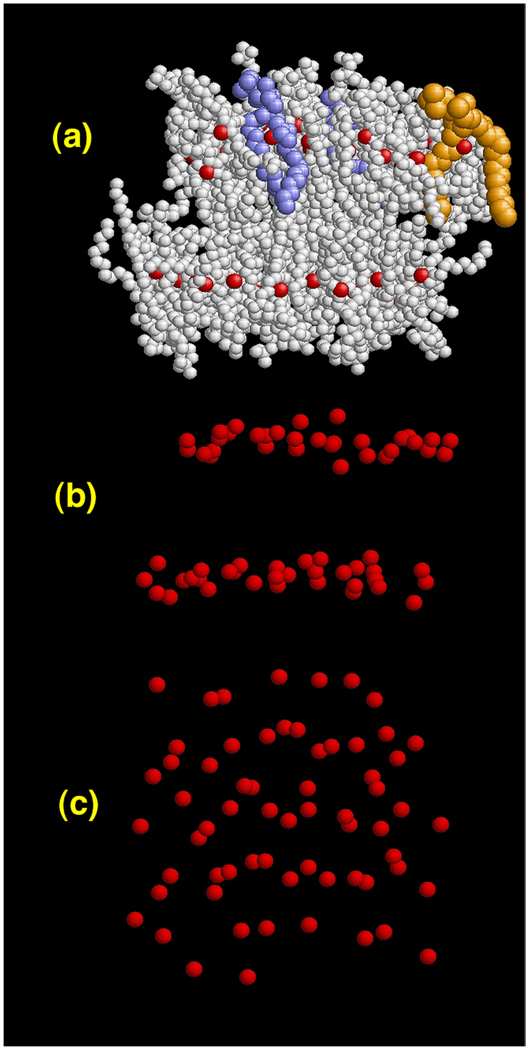
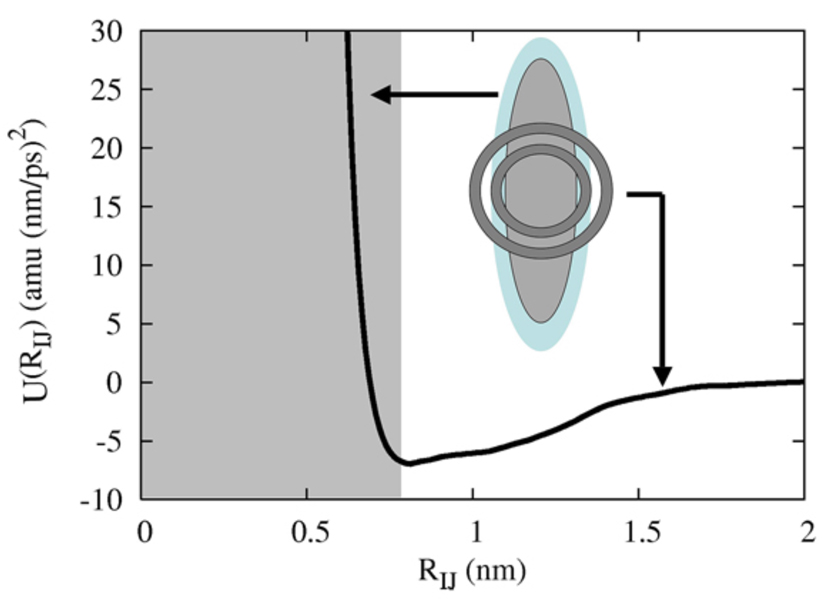
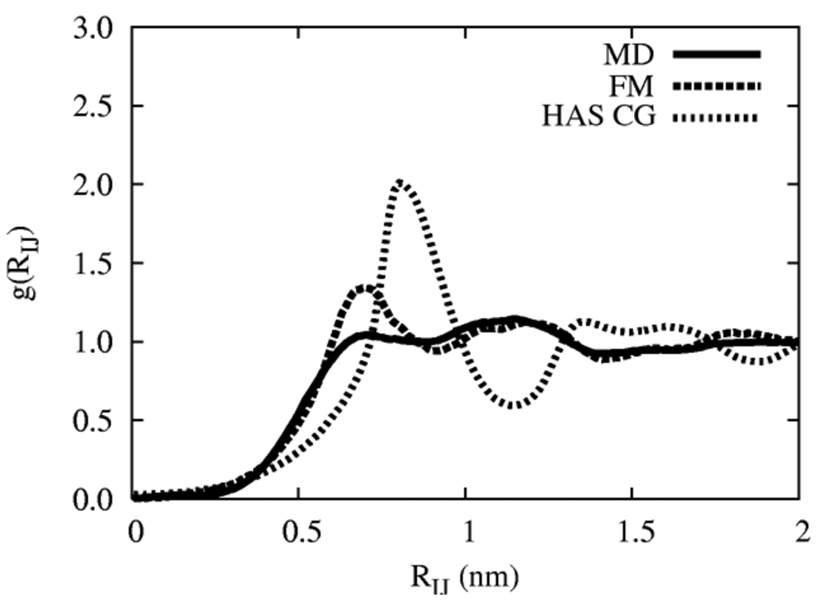
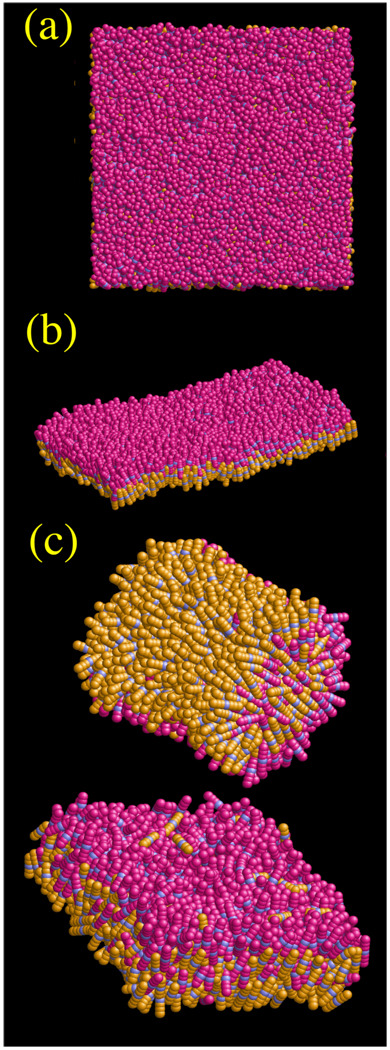
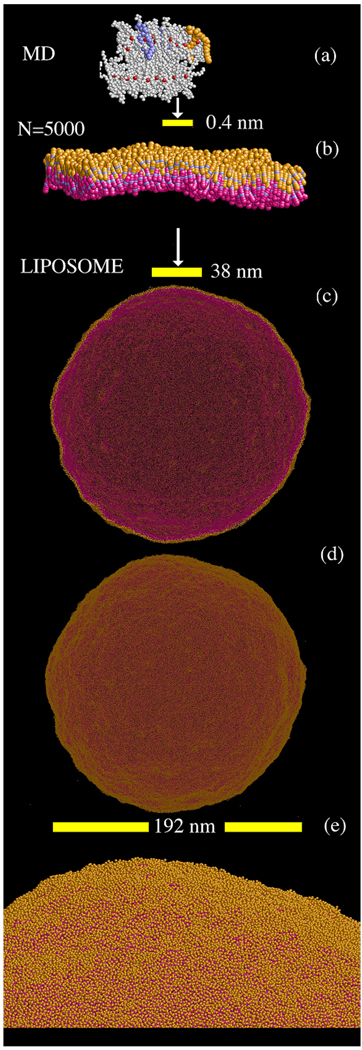
A hybrid analytic-systematic (HAS) coarse-grained (CG) lipid model is developed and employed in a large-scale simulation of a liposome. The methodology is termed hybrid analytic-systematic because one component of the interaction between CG sites is variationally determined from the multiscale coarse-graining (MS-CG) methodology, whereas the remaining component utilizes an analytic potential. The systematic component models the in-plane center-of-mass interaction of the lipids as determined from an atomistic-level MD simulation of a bilayer. The analytic component is based on the well-known Gay-Berne ellipsoid-of-revolution liquid-crystal model and is designed to model the highly anisotropic interactions at a highly coarse-grained level. The HAS CG approach is the first step in an "aggressive" CG methodology designed to model multicomponent biological membranes at very large length and time scales.


Figures

Figure 1
Figure 1
Simulation snapshots of the original atomistic DMPC system. Panel (a) shows DMPC lipids with the CG sites shown as red spheres. The colored lipids highlight the highly two disordered tail conformations in the liquid crystal phase. Panel (b) is the instantaneous locations of the COM CG sites corresponding to (a). A distinct bilayer structure is observed. Panel (c) is a top down view of the CG sites; very little structural correlation is observed and some of the lipid COM CG sites are quite close together.
Figure 2
Figure 2
The lipid COM radial distribution function (RDF) (solid line) along with the average of the ratio Rz/RIJ (dark dotted line) where here RIJ = |MRIxMRIy|, Rz = |MRIz − MRJz| and is the α Cartesian component corresponding to the COM of lipid I.
Figure 3
Figure 3
The HAS CG potential. The inset shows a single CG particle where the anisotropic component (the ellipsoid) corresponds to the “core”, the short-ranged spherically symmetric component comes from the MS-CG method and gives the attractive component of the interaction. The shaded region on the left corresponds to the potential arising from the superimposed anisotropic core region.
Figure 4
Figure 4
The CG RDF. The solid line is as given in Figure 2, the dark-dotted line is the CG RDF using a constant area 2D system, while the light-dashed line is the RDF for the HAS CG system in 3D under zero surface tension.
Figure 5
Figure 5
The accumulated average number of lipids in one of the membrane leaflets for the N=5000 CG site HAS membrane (dotted), the “raw GB” (hatched), and the COM atomistic MD simulation (solid line). The solid square is the estimated number of lipids around a central one based on the atomistic area per lipid.
Figure 6
Figure 6
Snapshots of the N=5000 CG site square patch HAS CG bilayer. Panel (a) shows a top down view; very little distinct structural correlation is evident. Panel (b) shows a side view where thermal undulations are clearly visible. Panel (c) shows two different self-assembled structures coming from an N=2048 CG site system. Bicellar as well as bilayer structures were observed depending on the volume of the system.
Figure 7
Figure 7
The undulation spectrum for an N=5000 CG site square patch of HAS (solid squares ) and a “raw GB” (open squares) CG membrane under zero surface tension. Error bars are from block averages. The bending modulus for the HAS membrane using the smallest q was found to be kc = 4.6 ± 0.2 × 10⁻²⁰ J , while the modulus for the raw GB membrane was significantly larger at kc = 8.0 × 10⁻²⁰ J. For comparison, the experimental bending modulus for DMPC is kc = 3 ~ 6 × 10⁻²⁰ J.
Figure 8
Figure 8
(a) The two dimensional mean square displacement (MSD), 〈|R(t) − R(0)|2〉 for the HAS (solid line) and “raw GB” (dotted) system. The corresponding diffusion coefficient is found from a linear fit, 〈|R(t) − R(0)|2〉 = 4Dt + b0, of the MSD for t > 0.8 ns for the HAS bilayer and is D = 1.2 × 10⁻⁷ cm2/s, compared to the experimental estimate of 1.10 × 10⁻⁷ cm2/s. The t = 0 intercept for this fit is b0 = 0.057 nm2, as shown by the small square. The corresponding raw GB bilayer is frozen. Panel (b) The quantity, log10(〈|R(t) − R(0)|2〉 − b0) versus log10(t) which is predicted to have a slope of unity at long times in the case that the linear fit proposed in (a) holds.
Figure 9
Figure 9
Relative lengthscales eventually reaching the HAS CG liposome with N = 379,858 total CG sites. Panel (a) shows the original MD system as in Figure 1, panel (b) is a snapshot of the N = 5000 HAS membrane. Panel (c) shows a slice of the HAS liposome after 60 ns of simulation, while (d) shows the entire surface. The lipids are colored as in Figure 6. The different scales are shown in the yellow scale bars. The liposome surface is clearly visible in the close-up in panel (e). The area per CG lipid evaluated over the surface area of the liposome was found to be 0.60 ± 0.02 nm2/CG lipid. The lipid flip flop rate was estimated at around 5 × 10⁻⁶ ns−1, based on counting the number of lipids that had moved from one leaflet to the other during the course of the simulation.

References

    1. Singer SJ, Nicolson GL. Science. 1972;175:720. - PubMed
    1. Engelman DM. Nature. 2005;438:578. - PubMed
    1. McLaughlin S, Murray D. Nature. 2005;438:605. - PubMed
    1. Dupuy AD, Engelman DM. Proc. Nat. Acad. Sci. 2008;105:2848. - PMC - PubMed
    1. Veatch SL, Keller SL. Biophys. J. 2003;85:3074. - PMC - PubMed

Publication types