. 2009 Apr 1;81(7):2437-45.
doi: 10.1021/ac802587r.

Method revealing bacterial cell-wall architecture by time-dependent isotope labeling and quantitative liquid chromatography/mass spectrometry

Affiliations

Method revealing bacterial cell-wall architecture by time-dependent isotope labeling and quantitative liquid chromatography/mass spectrometry

Gary J Patti et al. Anal Chem. .

Abstract

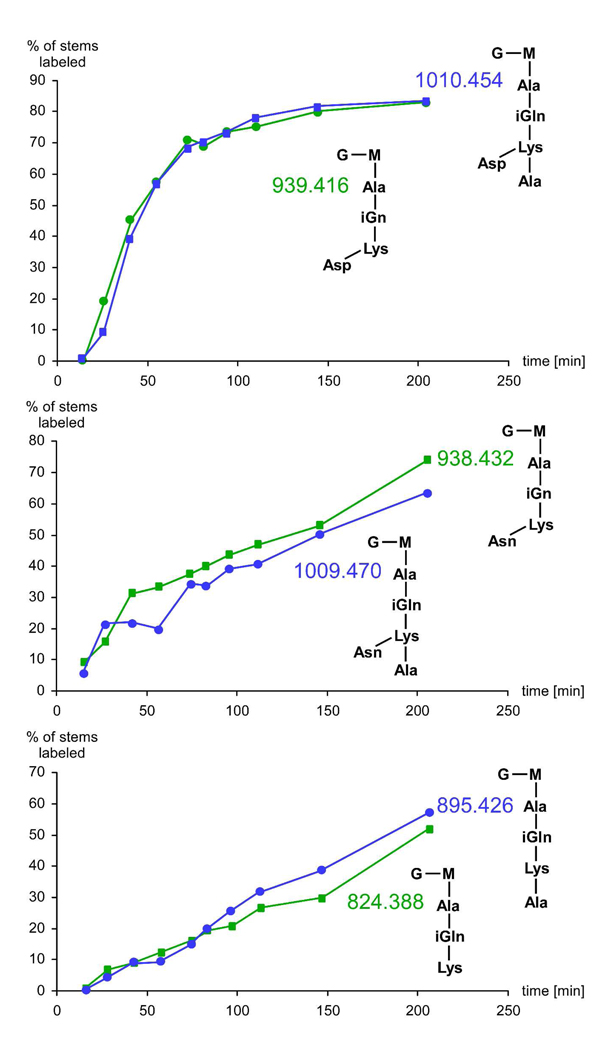
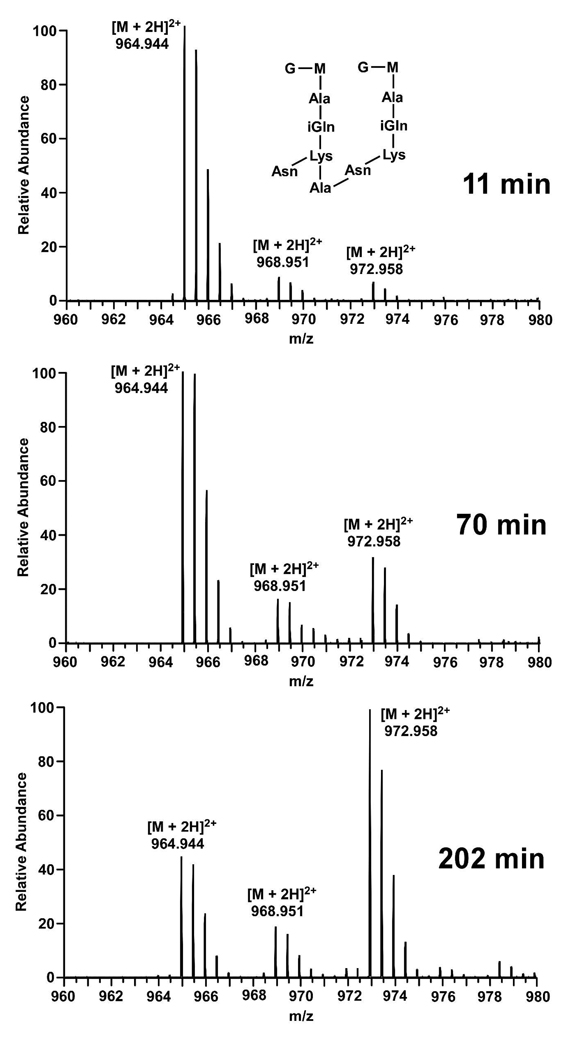
The molecular details of the biosynthesis and resulting architecture of the bacterial cell wall remain unclear but are essential to understanding the activity of glycopeptide antibiotics, the recognition of pathogens by hosts, and the processes of bacterial growth and division. Here we report a new strategy to elucidate bacterial cell-wall architecture based on time-dependent isotope labeling of bacterial cells quantified by liquid chromatography/accurate mass measurement mass spectrometry. The results allow us to track the fate of cell-wall precursors (which contain the vancomycin-binding site) in Enterococcus faecium, a leading antibiotic-resistant pathogen. By comparing isotopic enrichments of postinsertionally modified cell-wall precursors, we find that tripeptides and species without aspartic acid/asparagine (Asp/Asn, Asx) bridges are specific to mature cell wall. Additionally, we find that the sequence of cell-wall maturation varies throughout a cell cycle. We suggest that actively dividing E. faecium cells have three zones of unique peptidoglycan processing. Our results reveal new organizational characteristics of the bacterial cell wall that are important to understanding tertiary structure and designing novel drugs for antibiotic-resistant pathogens.


Conflict of interest statement

The authors declare no conflict of interest.

Figures

Figure 1
Figure 1
Labeling Strategy. (Left) Growth of E. faecium as measured by optical density (660 nm) as a function of time. The cells were pulsed and harvested at the points indicated. For the pulse-chase experiment, cells were resuspended in media containing natural-abundance isotopes at point i and harvested at point f. (Right) Chemical structure of E. faecium peptidoglycan before modification, highlighting L-[13C6, 15N2]lysine. The unmodified subunit contains a pentapeptide stem and a D-Asp bridge.
Figure 2
Figure 2
Plot of the Percentage of Isotopically Enriched Ions with respect to Time After Pulse. (Blue) Ions with an m/z of 1081.491. (Red) Ions with an m/z of 1080.507. (Green) Ions with an m/z of 824.388.
Figure 3
Figure 3
Plots of the Percentage of Isotopically Enriched Tri (green) and Tetrapeptides (blue) with respect to Time After Pulse. (Top) Ions with an m/z of 1010.454 and 939.416, corresponding to muropeptides with an aspartic-acid bridge. (Middle) Ions with an m/z of 938.432 and 1009.470, corresponding to muropeptides with an asparagine bridge. (Bottom) Ions with an m/z of 895.426 and 824.388, corresponding to muropeptides without bridges.
Figure 4
Figure 4
Mass Spectra for an Ion with an m/z of 1080.507 Corresponding to a Pentapeptide with an Asp Bridge. (Top) Cells harvested and analyzed after a 38 min pulse. (Middle) Cells chased for 54 min with media containing only natural-abundance isotopes after an initial 38 min pulse. (Bottom) Cells labeled continuously for 92 min.
Figure 5
Figure 5
Mass Spectra for the Ion with an m/z of 964.944 Corresponding to a Doubly-Charged Dimer with Asn Bridges. (Top) After an 11 min pulse. (Middle) After a 70 min pulse. (Bottom) After a 202 min pulse. The number of singly-labeled dimers incorporating one L-[13C6, 15N2]lysine remains relatively constant at all three time points.
Figure 6
Figure 6
Zones of Peptidoglycan Processing. (Top) Muropeptide processing characteristic of each of three proposed zones of growth. In zone I, pentapeptides with Asp bridges are cleaved into tri and tetrapeptides. In zone II, the Asp bridge is amidated to Asn first. Subsequently, tri and tetrapeptides are produced with Asn bridges. In mature peptidoglycan, zone III, the bridges of the structures are removed. (Bottom) Schematic of peptidoglycan processing during different phases of cell division. Cell-wall biosynthesis produces pentapeptides with D-Ala-D-Ala vancomycin-binding sites as indicated by red dots. In subsequent processing, the pentapeptides are cleaved into tripeptides that are represented by green dots. Cell-wall biosynthesis is most active during peripheral growth and in the formation and division of the cross wall (septum). We propose that zone I processing characterizes the septum, while zone II processing is unique to peripheral growth and cross-wall division.

References

    1. Aumeran C, Baud O, Lesens O, Delmas J, Souweine B, Traore O. Eur J Clin Microbiol Infect Dis. 2008 - PubMed
    1. Libisch B, Lepsanovic Z, Top J, Muzslay M, Konkoly-Thege M, Gacs M, Balogh B, Fuzi M, Willems RJ. Scand J Infect Dis. 2008:1–7. - PubMed
    1. Park IJ, Lee WG, Shin JH, Lee KW, Woo GJ. J Clin Microbiol. 2008 - PMC - PubMed
    1. Mainardi JL, Villet R, Bugg TD, Mayer C, Arthur M. FEMS Microbiol Rev. 2008;32:386–408. - PubMed
    1. Patti GJ, Kim SJ, Schaefer J. Biochemistry. 2008;47:8378–8385. - PMC - PubMed

Publication types