

CD73 is expressed by human regulatory T helper cells and suppresses proinflammatory cytokine production and Helicobacter felis-induced gastritis in mice
- PMID: 19281303
- PMCID: PMC3047419
- DOI: 10.1086/596205
CD73 is expressed by human regulatory T helper cells and suppresses proinflammatory cytokine production and Helicobacter felis-induced gastritis in mice
Abstract
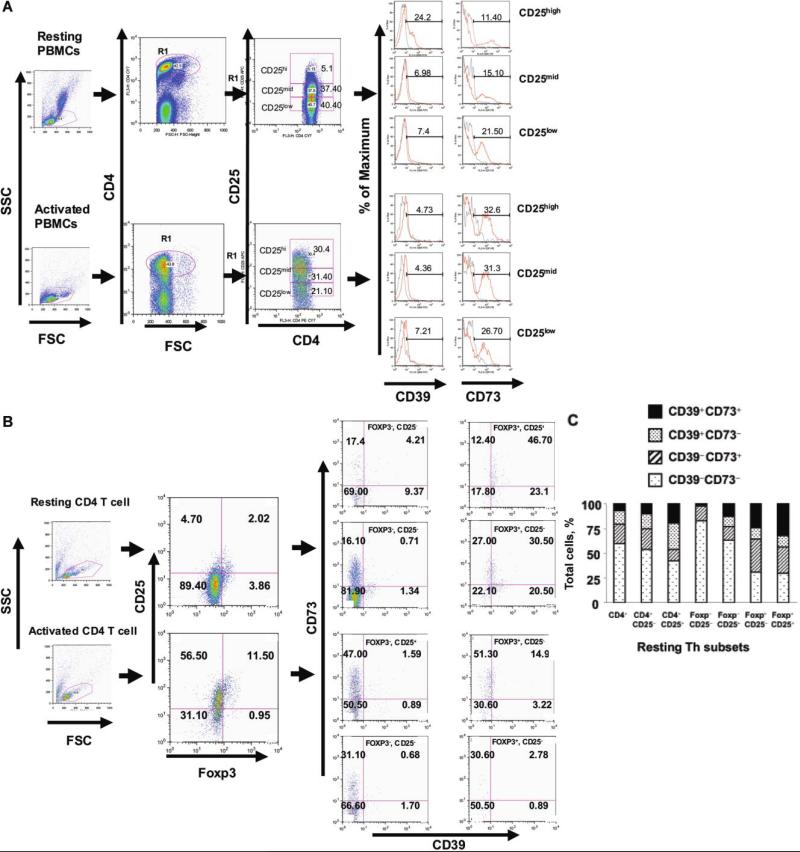
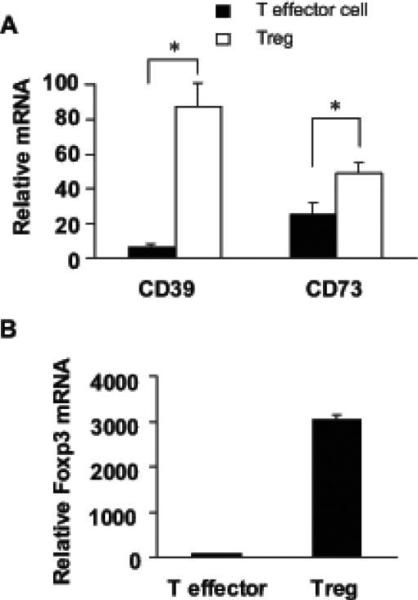
Background: Regulatory T cells (known as "Treg") express apyrases (CD39) and ecto-5'-nucleotidase (CD73) and contribute to their inhibitory function by generating adenosine. We investigated the expression of CD39 and CD73 on human T helper (Th) cells and the role of CD73 in regulating Helicobacter felis-induced gastritis and colonization.
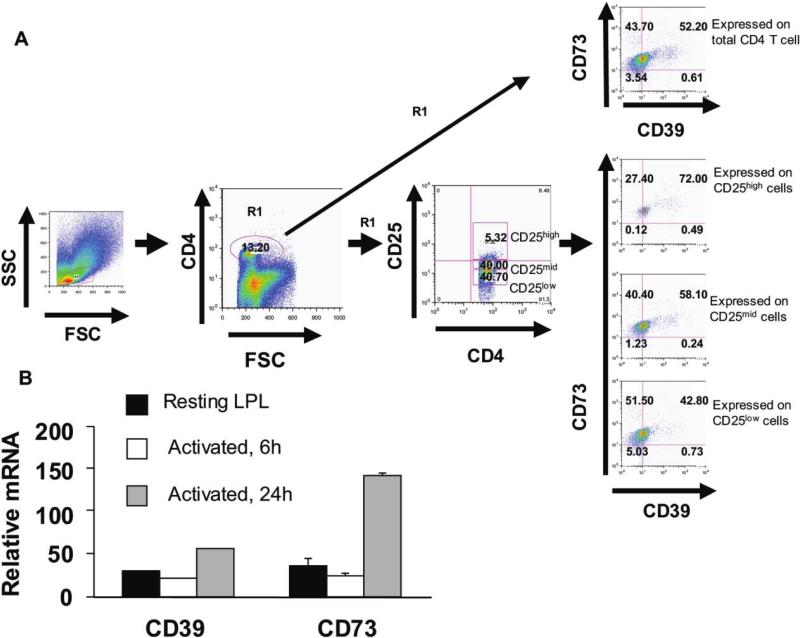
Methods: Human CD4+ Th cells, gastric T cells, or Treg subsets were stimulated and assayed for the expression of CD39 and CD73 by means of reverse-transcriptase polymerase chain reaction and flow cytometry. The effect of CD73 on proliferation and cytokine production was assessed, and the presence of gastritis, proinflammatory cytokine expression, or colonization of H. felis was evaluated in CD73-deficient (CD73-/-) mice or recipient mice given control or CD73-/- Treg.
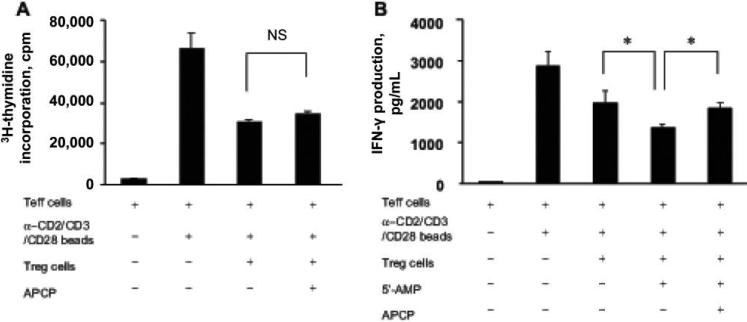
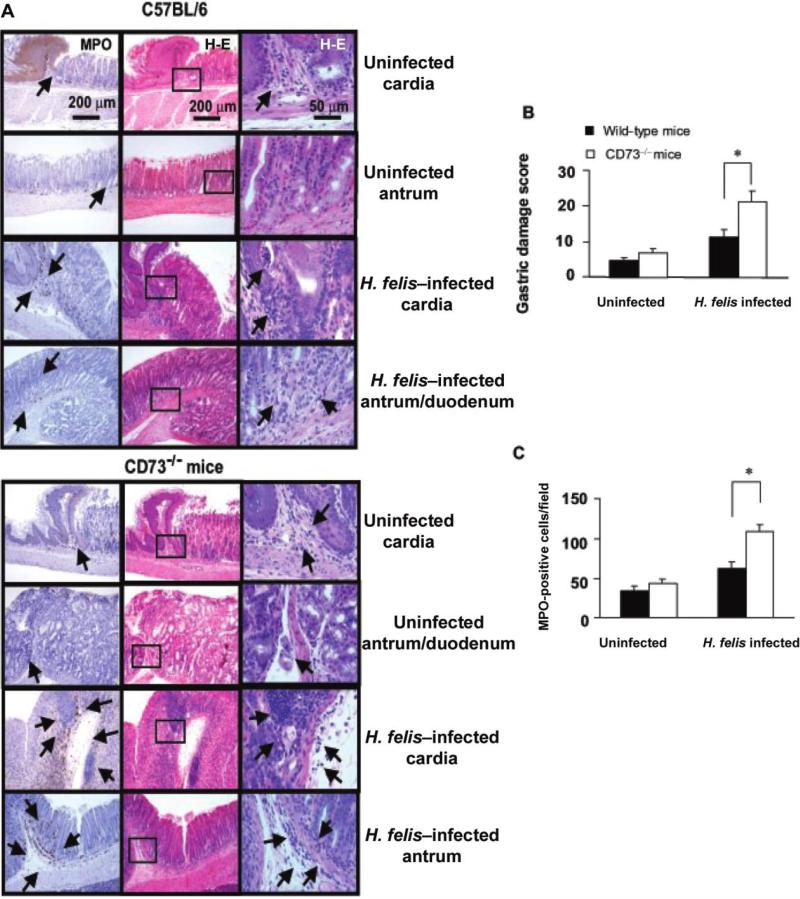
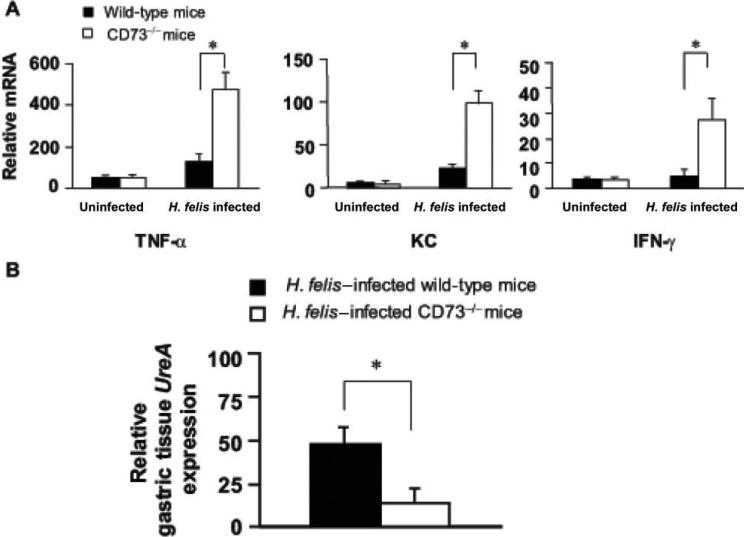
Results: CD4+ T cells expressed CD39 and CD73, particularly in CD25+Foxp3+ Treg from peripheral blood or gastric mucosa. Activation significantly increased CD73 expression on all Th cells. Inhibition of CD73 enhanced production of interferon-gamma. Gastritis in H. felis-infected CD73-/- mice was significantly worse than that in wild-type mice and was accompanied by increased levels of proinflammatory cytokines and reduced bacterial colonization, whereas Treg from CD73-/- mice did not inhibit gastritis.
Conclusion: CD39 and CD73 expressed by Th cells contribute to local accumulation of adenosine and attenuation of gastritis, which may favor persistent infection.
Figures

Similar articles
-
A2A adenosine receptor (AR) activation inhibits pro-inflammatory cytokine production by human CD4+ helper T cells and regulates Helicobacter-induced gastritis and bacterial persistence.Mucosal Immunol. 2009 May;2(3):232-42. doi: 10.1038/mi.2009.4. Epub 2009 Mar 4. Mucosal Immunol. 2009. PMID: 19262506 Free PMC article.
-
Adenosine and the adenosine A2A receptor agonist, CGS21680, upregulate CD39 and CD73 expression through E2F-1 and CREB in regulatory T cells isolated from septic mice.Int J Mol Med. 2016 Sep;38(3):969-75. doi: 10.3892/ijmm.2016.2679. Epub 2016 Jul 14. Int J Mol Med. 2016. PMID: 27430240
-
Human CD4+ CD39+ regulatory T cells produce adenosine upon co-expression of surface CD73 or contact with CD73+ exosomes or CD73+ cells.Clin Exp Immunol. 2014 Aug;177(2):531-43. doi: 10.1111/cei.12354. Clin Exp Immunol. 2014. PMID: 24749746 Free PMC article.
-
Extracellular adenosine generation in the regulation of pro-inflammatory responses and pathogen colonization.Biomolecules. 2015 May 5;5(2):775-92. doi: 10.3390/biom5020775. Biomolecules. 2015. PMID: 25950510 Free PMC article. Review.
-
CD73 and adenosine generation in the creation of regulatory microenvironments.Clin Exp Immunol. 2013 Jan;171(1):1-7. doi: 10.1111/j.1365-2249.2012.04623.x. Clin Exp Immunol. 2013. PMID: 23199317 Free PMC article. Review.
Cited by
-
Purinergic signalling and immune cells.Purinergic Signal. 2014 Dec;10(4):529-64. doi: 10.1007/s11302-014-9427-2. Epub 2014 Oct 29. Purinergic Signal. 2014. PMID: 25352330 Free PMC article. Review.
-
Bispecific antibodies tethering innate receptors induce human tolerant-dendritic cells and regulatory T cells.Front Immunol. 2024 Mar 26;15:1369117. doi: 10.3389/fimmu.2024.1369117. eCollection 2024. Front Immunol. 2024. PMID: 38601165 Free PMC article.
-
Increased numbers of Foxp3-positive regulatory T cells in gastritis, peptic ulcer and gastric adenocarcinoma.World J Gastroenterol. 2012 Jan 7;18(1):34-43. doi: 10.3748/wjg.v18.i1.34. World J Gastroenterol. 2012. PMID: 22228968 Free PMC article.
-
Nonhuman Primate Testing of the Impact of Different Regulatory T Cell Depletion Strategies on Reactivation and Clearance of Latent Simian Immunodeficiency Virus.J Virol. 2020 Sep 15;94(19):e00533-20. doi: 10.1128/JVI.00533-20. Print 2020 Sep 15. J Virol. 2020. PMID: 32669326 Free PMC article.
-
Autocrine adenosine signaling promotes regulatory T cell-mediated renal protection.J Am Soc Nephrol. 2012 Sep;23(9):1528-37. doi: 10.1681/ASN.2012010070. Epub 2012 Jul 26. J Am Soc Nephrol. 2012. PMID: 22835488 Free PMC article.
References
-
- Dixon MF. Pathophysiology of Helicobacter pylori infection. Scand J Gastroenterol Suppl. 1994;201:7–10. - PubMed
-
- Ernst PB, Gold B. The disease spectrum of H. pylori: the immunopatho-genesis of gastroduodenal ulcer and gastric cancer. Annu Rev Microbiol. 2000;54:615–40. - PubMed
-
- Hopkins RJ, Girardi LS, Turney EA. Relationship between Helicobacter pylori eradication and reduced duodenal and gastric ulcer recurrence: a review. Gastroenterology. 1996;110:1244–52. - PubMed
-
- Ernst PB, Peura DA, Crowe SE. The translation of Helicobacter pylori basic research to patient care. Gastroenterology. 2006;130:188–206. - PubMed
-
- Correa P, Miller MJ. Carcinogenesis, apoptosis and cell proliferation. Br Med Bull. 1998;54:151–62. - PubMed
Publication types
MeSH terms
Substances
Grants and funding
- R01 AI079145/AI/NIAID NIH HHS/United States
- DK 56703/DK/NIDDK NIH HHS/United States
- P30 DK067629/DK/NIDDK NIH HHS/United States
- DK50980/DK/NIDDK NIH HHS/United States
- RR00175/RR/NCRR NIH HHS/United States
- R01 HL056111/HL/NHLBI NIH HHS/United States
- T32 AI007046/AI/NIAID NIH HHS/United States
- R01 HL037942/HL/NHLBI NIH HHS/United States
- K26 RR000175/RR/NCRR NIH HHS/United States
- U01 AI070491/AI/NIAID NIH HHS/United States
- R01 DK050980/DK/NIDDK NIH HHS/United States
- R21 AI069880/AI/NIAID NIH HHS/United States
- AI069880/AI/NIAID NIH HHS/United States
- AI70491/AI/NIAID NIH HHS/United States
LinkOut - more resources
Full Text Sources
Medical
Research Materials
