Transcutaneous Raman spectroscopy of murine bone in vivo
- PMID: 19281644
- PMCID: PMC2659467
- DOI: 10.1366/000370209787599013
Transcutaneous Raman spectroscopy of murine bone in vivo
Abstract
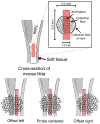
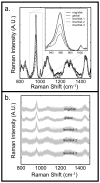
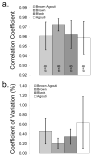
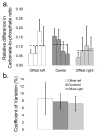
Raman spectroscopy can provide valuable information about bone tissue composition in studies of bone development, biomechanics, and health. In order to study the Raman spectra of bone in vivo, instrumentation that enhances the recovery of subsurface spectra must be developed and validated. Five fiber-optic probe configurations were considered for transcutaneous bone Raman spectroscopy of small animals. Measurements were obtained from the tibia of sacrificed mice, and the bone Raman signal was recovered for each probe configuration. The configuration with the optimal combination of bone signal intensity, signal variance, and power distribution was then evaluated under in vivo conditions. Multiple in vivo transcutaneous measurements were obtained from the left tibia of 32 anesthetized mice. After collecting the transcutaneous Raman signal, exposed bone measurements were collected and used as a validation reference. Multivariate analysis was used to recover bone spectra from transcutaneous measurements. To assess the validity of the transcutaneous bone measurements cross-correlations were calculated between standardized spectra from the recovered bone signal and the exposed bone measurements. Additionally, the carbonate-to-phosphate height ratios of the recovered bone signals were compared to the reference exposed bone measurements. The mean cross-correlation coefficient between the recovered and exposed measurements was 0.96, and the carbonate-to-phosphate ratios did not differ significantly between the two sets of spectra (p > 0.05). During these first systematic in vivo Raman measurements, we discovered that probe alignment and animal coat color influenced the results and thus should be considered in future probe and study designs. Nevertheless, our noninvasive Raman spectroscopic probe accurately assessed bone tissue composition through the skin in live mice.
Figures


Similar articles
-
Noninvasive Raman spectroscopy of rat tibiae: approach to in vivo assessment of bone quality.J Biomed Opt. 2012 Sep;17(9):90502-1. doi: 10.1117/1.JBO.17.9.090502. J Biomed Opt. 2012. PMID: 23085899 Free PMC article.
-
Transcutaneous fiber optic Raman spectroscopy of bone using annular illumination and a circular array of collection fibers.J Biomed Opt. 2006 Nov-Dec;11(6):060502. doi: 10.1117/1.2400233. J Biomed Opt. 2006. PMID: 17212521
-
Subsurface and transcutaneous Raman spectroscopy and mapping using concentric illumination rings and collection with a circular fiber-optic array.Appl Spectrosc. 2007 Jul;61(7):671-8. doi: 10.1366/000370207781393307. Appl Spectrosc. 2007. PMID: 17697459
-
Fiber optic near-infrared Raman spectroscopy for clinical noninvasive determination of water content in diseased skin and assessment of cutaneous edema.J Biomed Opt. 2005 Jan-Feb;10(1):14013. doi: 10.1117/1.1854682. J Biomed Opt. 2005. PMID: 15847594 Review.
-
Raman assessment of bone quality.Clin Orthop Relat Res. 2011 Aug;469(8):2160-9. doi: 10.1007/s11999-010-1692-y. Clin Orthop Relat Res. 2011. PMID: 21116756 Free PMC article. Review.
Cited by
-
In Vivo Longitudinal Monitoring of Disease Progression in Inflammatory Arthritis Animal Models Using Raman Spectroscopy.Anal Chem. 2023 Feb 21;95(7):3720-3728. doi: 10.1021/acs.analchem.2c04743. Epub 2023 Feb 9. Anal Chem. 2023. PMID: 36757324 Free PMC article.
-
Vibrational spectroscopic imaging for the evaluation of matrix and mineral chemistry.Curr Osteoporos Rep. 2014 Dec;12(4):454-64. doi: 10.1007/s11914-014-0238-8. Curr Osteoporos Rep. 2014. PMID: 25240579 Free PMC article. Review.
-
Raman and mechanical properties correlate at whole bone- and tissue-levels in a genetic mouse model.J Biomech. 2011 Jan 11;44(2):297-303. doi: 10.1016/j.jbiomech.2010.10.009. Epub 2010 Oct 28. J Biomech. 2011. PMID: 21035119 Free PMC article.
-
[Research progress of traumatic heterotopic ossification].Zhongguo Xiu Fu Chong Jian Wai Ke Za Zhi. 2022 Mar 15;36(3):386-394. doi: 10.7507/1002-1892.202110078. Zhongguo Xiu Fu Chong Jian Wai Ke Za Zhi. 2022. PMID: 35293183 Free PMC article. Review. Chinese.
-
Correlative micro-Raman/EPMA analysis of the hydraulic calcium silicate cement interface with dentin.Clin Oral Investig. 2016 Sep;20(7):1663-73. doi: 10.1007/s00784-015-1650-x. Epub 2015 Nov 10. Clin Oral Investig. 2016. PMID: 26556572
References
-
- Crane NJ, Popescu V, Morris MD, Steenhuis P, Ignelzi MA., Jr Bone. 2006;39(3):434. - PubMed
-
- Kozloff KM, Carden A, Bergwitz C, Forlino A, Uveges TE, Morris MD, Marini JC, Goldstein SA. J Bone Miner Res. 2004;19(4):614. - PubMed
-
- Tarnowski CP, Ignelzi MA, Jr, Morris MD. J Bone Miner Res. 2002;17(6):1118. - PubMed
-
- Carden A, Rajachar RM, Morris MD, Kohn DH. Calcif Tissue Int. 2003;72(2):166. - PubMed
-
- Dooley KA, McCormack J, Fyhrie DP, Morris MD. Proc SPIE. 2008;6853:68530Z.
Publication types
MeSH terms
Grants and funding
LinkOut - more resources
Full Text Sources

