

Age-related gray matter volume changes in the brain during non-elderly adulthood
- PMID: 19282066
- PMCID: PMC3004040
- DOI: 10.1016/j.neurobiolaging.2009.02.008
Age-related gray matter volume changes in the brain during non-elderly adulthood
Abstract
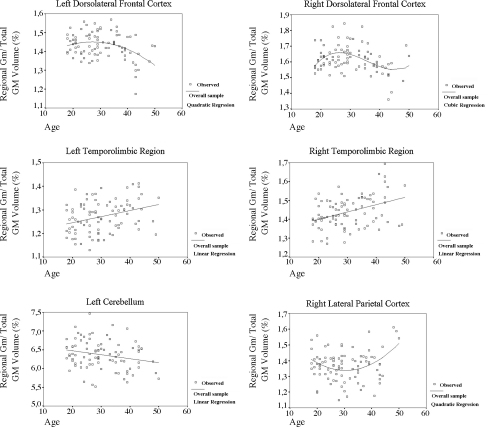
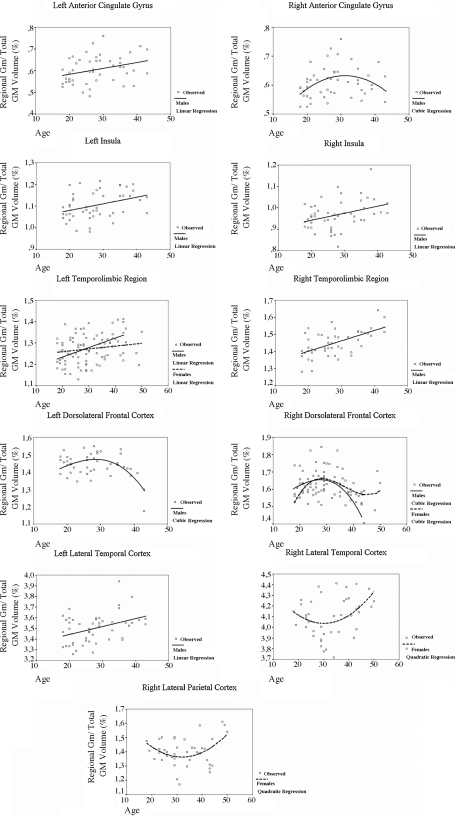
Previous magnetic resonance imaging (MRI) studies described consistent age-related gray matter (GM) reductions in the fronto-parietal neocortex, insula and cerebellum in elderly subjects, but not as frequently in limbic/paralimbic structures. However, it is unclear whether such features are already present during earlier stages of adulthood, and if age-related GM changes may follow non-linear patterns at such age range. This voxel-based morphometry study investigated the relationship between GM volumes and age specifically during non-elderly life (18-50 years) in 89 healthy individuals (48 males and 41 females). Voxelwise analyses showed significant (p<0.05, corrected) negative correlations in the right prefrontal cortex and left cerebellum, and positive correlations (indicating lack of GM loss) in the medial temporal region, cingulate gyrus, insula and temporal neocortex. Analyses using ROI masks showed that age-related dorsolateral prefrontal volume decrements followed non-linear patterns, and were less prominent in females compared to males at this age range. These findings further support for the notion of a heterogeneous and asynchronous pattern of age-related brain morphometric changes, with region-specific non-linear features.
Copyright © 2009 Elsevier Inc. All rights reserved.
Figures

References
-
- Abe O., Yamasue H., Aoki S., Suga M., Yamada H., Kasai K., Masutani Y., Kato N., Kato N., Ohtomo K. Aging in the CNS: comparison of gray/white matter volume and diffusion tensor data. Neurobiol. Aging. 2008;29:102–116. - PubMed
-
- Adler C.M., DelBello M.P., Jarvis K., Levine A., Adams J., Strakowski S.M. Voxel-based study of structural changes in first-episode patients with bipolar disorder. Biol. Psychiatry. 2007;61:776–781. - PubMed
-
- Alexander G.E., Chen K., Merkley T.L., Reiman E.M., Caselli R.J., Aschenbrenner M., Santerre-Lemmon L., Lewis D.J., Pietrini P., Teipel S.J., Hampel H., Rapoport S.I., Moeller J.R. Regional network of magnetic resonance imaging gray matter volume in healthy aging. Neuroreport. 2006;17:951–956. - PubMed
-
- Allen J.S., Bruss J., Brown C.K., Damasio H. Normal neuroanatomical variation due to age: the major lobes and a parcellation of the temporal region. Neurobiol. Aging. 2005;26:1245–1260. - PubMed
-
- Benedetti B., Charil A., Rovaris M., Judica E., Valsasina P., Sormani M.P., Filippi M. Influence of aging on brain gray and white matter changes assessed by conventional, MT, and DT MRI. Neurology. 2006;66:535–539. - PubMed
Publication types
MeSH terms
Grants and funding
LinkOut - more resources
Full Text Sources
Medical
