. 2009 Apr;68(8):1439-47.
doi: 10.1016/j.socscimed.2009.02.003. Epub 2009 Mar 11.

Tobacco control policies are egalitarian: a vulnerabilities perspective on clean indoor air laws, cigarette prices, and tobacco use disparities

Affiliations

Tobacco control policies are egalitarian: a vulnerabilities perspective on clean indoor air laws, cigarette prices, and tobacco use disparities

Alexis Dinno et al. Soc Sci Med. 2009 Apr.

Abstract

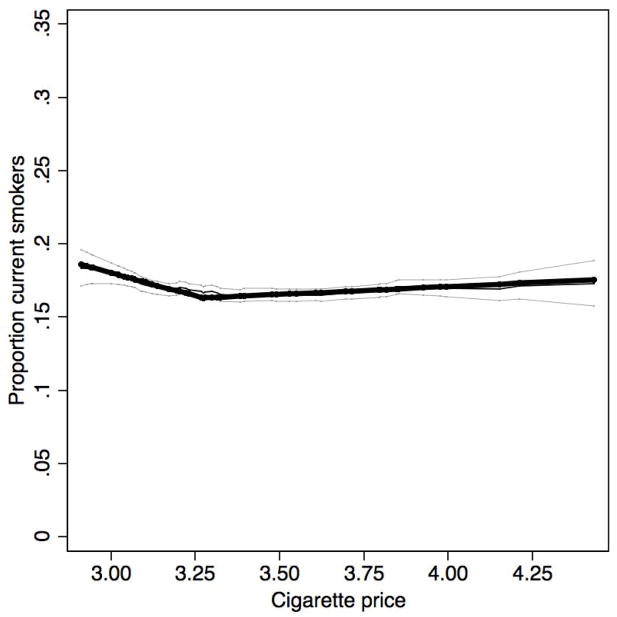
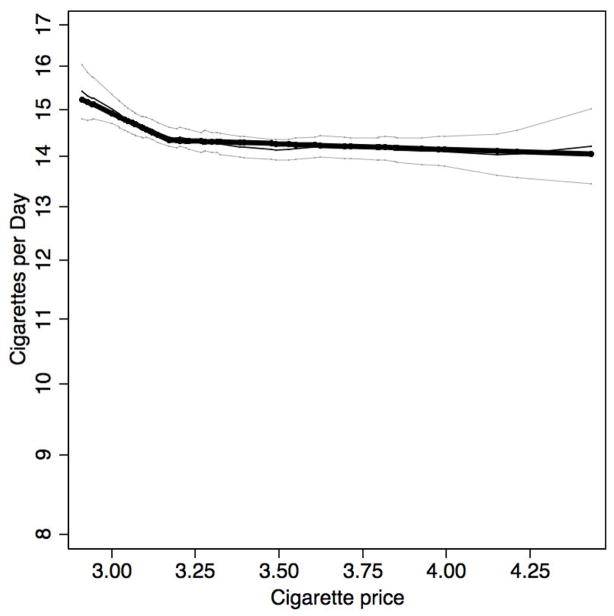
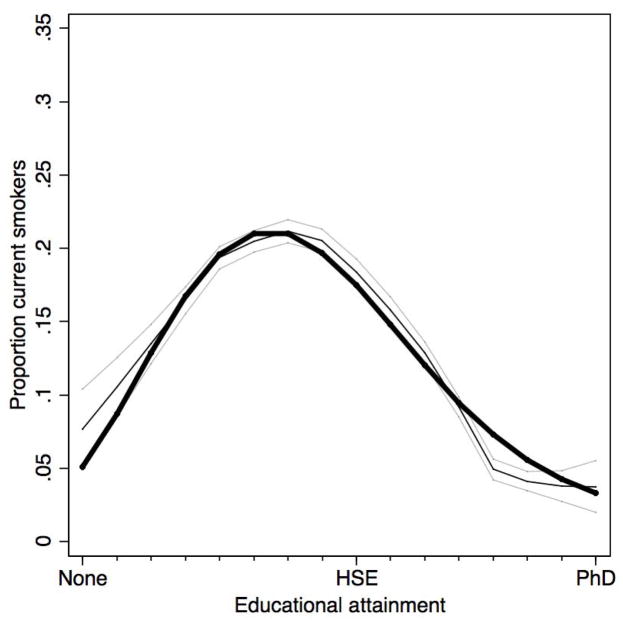
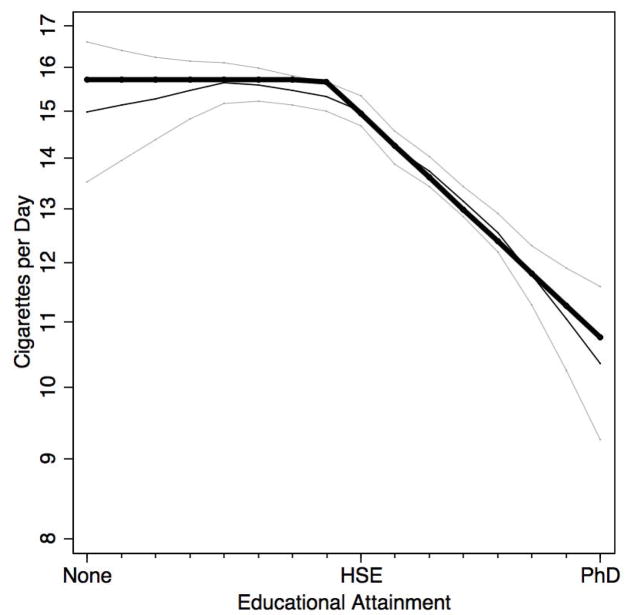
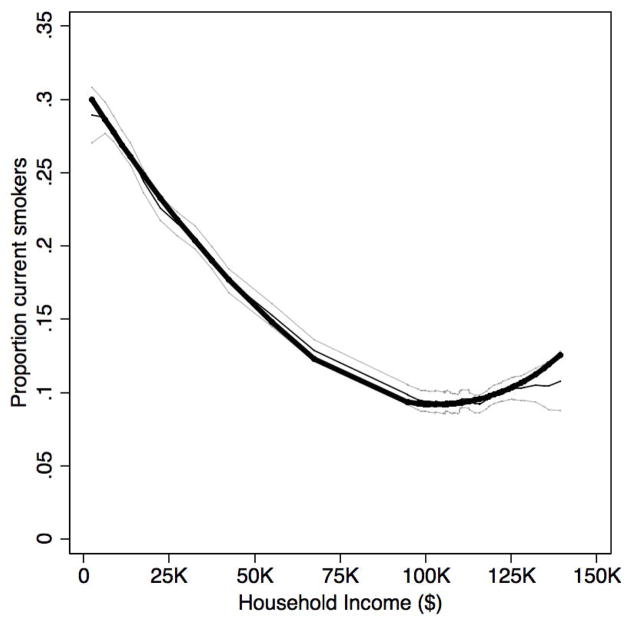
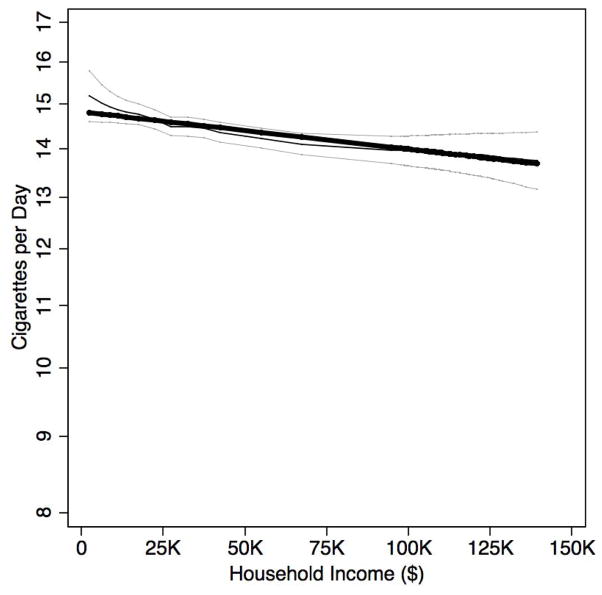
This study models independent associations of state or local strong clean indoor air laws and cigarette prices with current smoker status and consumption in a multilevel framework, including interactions with educational attainment, household income and race/ethnicity and the relationships of these policies to vulnerabilities in smoking behavior. Cross sectional survey data are employed from the February 2002 panel of the Tobacco Use Supplement of the Current Population Survey (54,024 individuals representing the US population aged 15-80). Non-linear relationships between both outcome variables and the predictors were modeled. Independent associations of strong clean indoor air laws were found for current smoker status (OR 0.66), and consumption among current smokers (-2.36 cigarettes/day). Cigarette price was found to have independent associations with both outcomes, an effect that saturated at higher prices. The odds ratio for smoking for the highest versus lowest price over the range where there was a price effect was 0.83. Average consumption declined (-1.16 cigarettes/day) over the range of effect of price on consumption. Neither policy varied in its effect by educational attainment, or household income. The association of cigarette price with reduced smoking participation and consumption was not found to vary with race/ethnicity. Population vulnerability in consumption appears to be structured by non-white race categories, but not at the state and county levels at which the policies we studied were enacted. Clean indoor air laws and price increases appear to benefit all socio-economic and race/ethnic groups in our study equally in terms of reducing smoking participation and consumption.


Figures

Figure 1
Figure 1
Nonlinear regression models (thick black lines) of the effect of cigarette price per pack (dollars) on current smoking (A), and ln(cigarettes/day) (B) from Equations S1a–S1b overlaid on the results of nonparametric models (thin black lines) with pointwise 95% confidence intervals (thin grey lines) from Equations 1a–1b. A piecewise linear specification reflects the initial decreasing effect of price, followed by a change in effect evident in both models. Equation 2a estimated that the change in effect of price on current smoker status was at $3.28 (SE 0.08) and Equation 2b estimated that saturation for the effect of price on ln(cigarettes/day) was at $3.17 (SE 0.42).
Figure 1
Figure 1
Nonlinear regression models (thick black lines) of the effect of cigarette price per pack (dollars) on current smoking (A), and ln(cigarettes/day) (B) from Equations S1a–S1b overlaid on the results of nonparametric models (thin black lines) with pointwise 95% confidence intervals (thin grey lines) from Equations 1a–1b. A piecewise linear specification reflects the initial decreasing effect of price, followed by a change in effect evident in both models. Equation 2a estimated that the change in effect of price on current smoker status was at $3.28 (SE 0.08) and Equation 2b estimated that saturation for the effect of price on ln(cigarettes/day) was at $3.17 (SE 0.42).
Figure 2
Figure 2
Nonlinear regression models (thick black lines) of the effect of educational attainment (see Table 1 for coding details) on current smoking (A), and ln(cigarettes/day) (B) from Equations S1a–S1b overlaid on the parallel nonparametric models (thin black lines) with pointwise 95% confidence intervals (thin grey lines) from Equations 1a–1b. A fully cubic specification models educational attainment’s effect on current smoker status, producing the fit in Panel A. A linear threshold of ln(cigarettes/day) reflects the initial unresponsiveness of consumption to educational attainment followed by a strong negative effect at four years of high school education or more. Equation 2b estimated that the change in effect of educational attainment on ln(cigarettes/day) status was at twelfth grade, but no diploma, and higher (38, SE 0.71).
Figure 2
Figure 2
Nonlinear regression models (thick black lines) of the effect of educational attainment (see Table 1 for coding details) on current smoking (A), and ln(cigarettes/day) (B) from Equations S1a–S1b overlaid on the parallel nonparametric models (thin black lines) with pointwise 95% confidence intervals (thin grey lines) from Equations 1a–1b. A fully cubic specification models educational attainment’s effect on current smoker status, producing the fit in Panel A. A linear threshold of ln(cigarettes/day) reflects the initial unresponsiveness of consumption to educational attainment followed by a strong negative effect at four years of high school education or more. Equation 2b estimated that the change in effect of educational attainment on ln(cigarettes/day) status was at twelfth grade, but no diploma, and higher (38, SE 0.71).
Figure 3
Figure 3
Nonlinear regression models (thick black lines) of the effect of household income (dollars) on current smoking (A), and ln(cigarettes/day) (B) from equations S1a–S1b overlaid on the parallel nonparametric models (thin black lines) with pointwise 95% confidence intervals (thin grey lines) from equations 1a–1b. A linear specification with a quadratic change in effect models current smoker status at $70K (SE 7.1K) to model the nonparametric relationship in Panel A. A linear specification models the effect of household income on ln(cigarettes/day) as shown in Panel B.
Figure 3
Figure 3
Nonlinear regression models (thick black lines) of the effect of household income (dollars) on current smoking (A), and ln(cigarettes/day) (B) from equations S1a–S1b overlaid on the parallel nonparametric models (thin black lines) with pointwise 95% confidence intervals (thin grey lines) from equations 1a–1b. A linear specification with a quadratic change in effect models current smoker status at $70K (SE 7.1K) to model the nonparametric relationship in Panel A. A linear specification models the effect of household income on ln(cigarettes/day) as shown in Panel B.

Similar articles

Cited by

References

    1. Ahern J, Galea S, Hubbard A, Karpati A. Population vulnerabilities and capacities related to health: A test of a model. Social Science & Medicine. 2008;66:691–703. - PMC - PubMed
    1. American Lung Association. State of Tobacco Control: 2002. American Lung Association; 2003.
    1. Armour B, Woollery T, Malarcher A, Pechacek T, Husten C. Annual smoking-attributable mortality, years of potential life lost, and productivity losses-United States, 1997–2001. Morbidity and Mortality Weekly Report. 2005;54(25):625–628. - PubMed
    1. Barbeau EM, Krieger N, Soobader MJ. Working Class Matters: Socioeconomic Disadvantage, Race/Ethnicity, Gender, and Smoking in NHIS 2000. American Journal of Public Health. 2004;94(2):269–278. - PMC - PubMed
    1. Barbeau EM, McLellan D, Levenstein C, DeLaurier GF, Kelder G, Sorensen G. Reducing occupation-based disparities related to tobacco: Roles for occupational health and organized labor. American Journal of Industrial Medicine. 2004;46(2):170–179. - PubMed

Publication types

MeSH terms

Substances