. 2009 May 29;284(22):14796-808.
doi: 10.1074/jbc.M806486200. Epub 2009 Mar 11.

Type II cGMP-dependent protein kinase mediates osteoblast mechanotransduction

Affiliations

Type II cGMP-dependent protein kinase mediates osteoblast mechanotransduction

Hema Rangaswami et al. J Biol Chem. .

Abstract

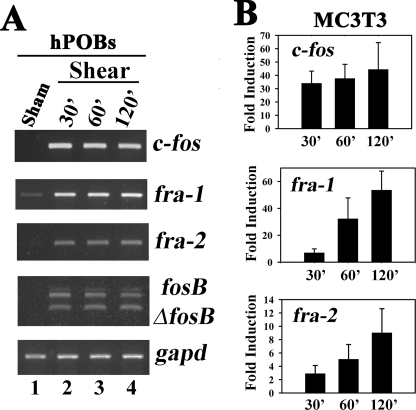
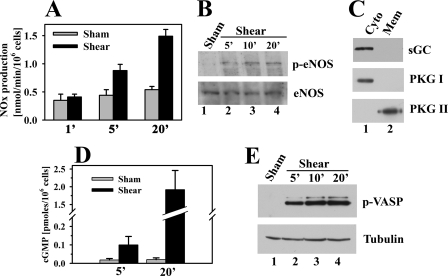
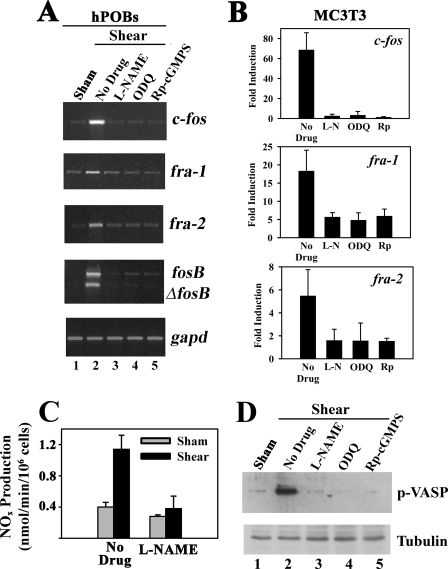
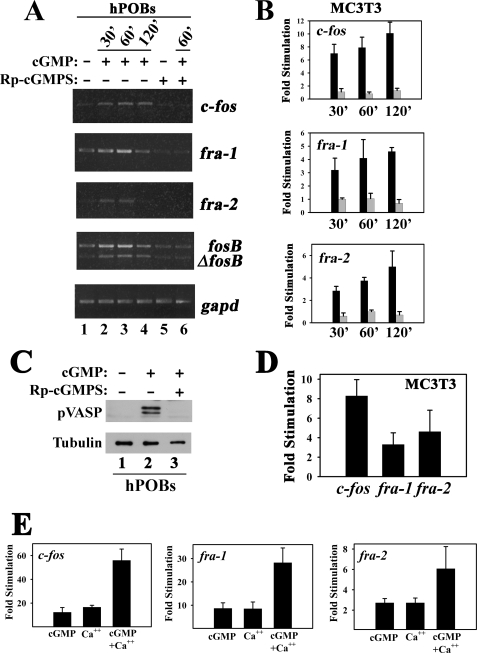
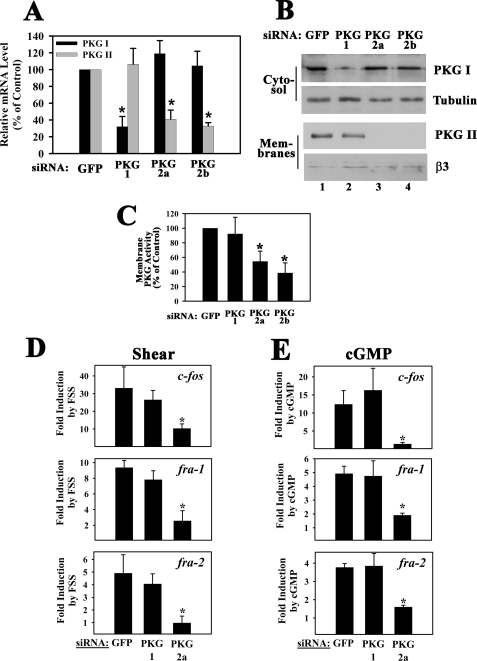
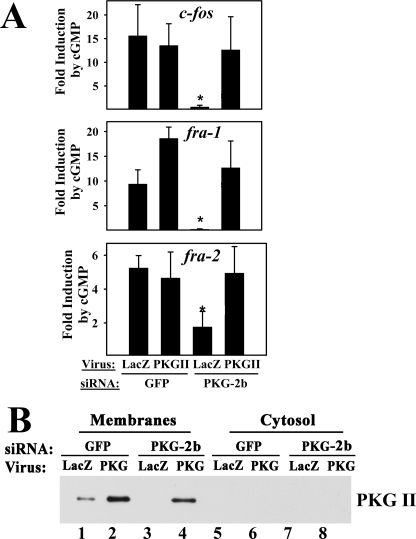
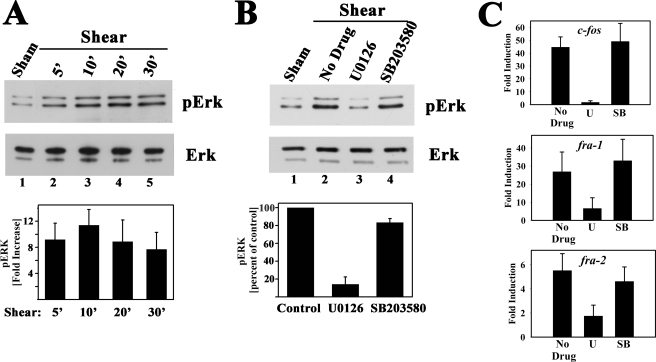
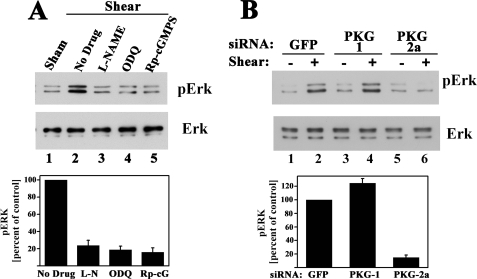
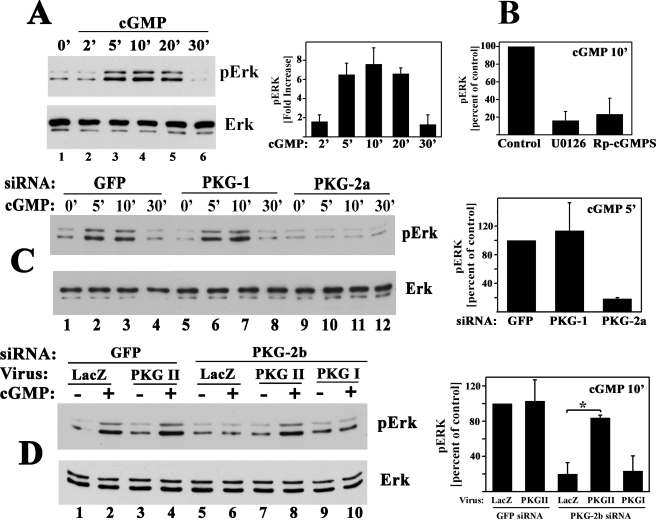
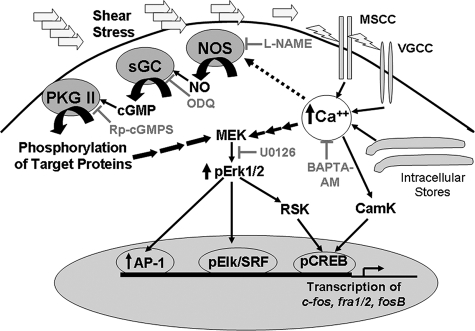
Continuous bone remodeling in response to mechanical loading is critical for skeletal integrity, and interstitial fluid flow is an important stimulus for osteoblast/osteocyte growth and differentiation. However, the biochemical signals mediating osteoblast anabolic responses to mechanical stimulation are incompletely understood. In primary human osteoblasts and murine MC3T3-E1 cells, we found that fluid shear stress induced rapid expression of c-fos, fra-1, fra-2, and fosB/DeltafosB mRNAs; these genes encode transcriptional regulators that maintain skeletal integrity. Fluid shear stress increased osteoblast nitric oxide (NO) synthesis, leading to activation of cGMP-dependent protein kinase (PKG). Pharmacological inhibition of the NO/cGMP/PKG signaling pathway blocked shear-induced expression of all four fos family genes. Induction of these genes required signaling through MEK/Erk, and Erk activation was NO/cGMP/PKG-dependent. Treating cells with a membrane-permeable cGMP analog partly mimicked the effects of fluid shear stress on Erk activity and fos family gene expression. In cells transfected with small interfering RNAs (siRNA) specific for membrane-bound PKG II, shear- and cGMP-induced Erk activation and fos family gene expression was nearly abolished and could be restored by transducing cells with a virus encoding an siRNA-resistant form of PKG II; in contrast, siRNA-mediated repression of the more abundant cytosolic PKG I isoform was without effect. Thus, we report a novel function for PKG II in osteoblast mechanotransduction, and we propose a model whereby NO/cGMP/PKG II-mediated Erk activation and induction of c-fos, fra-1, fra-2, and fosB/DeltafosB play a key role in the osteoblast anabolic response to mechanical stimulation.


Figures

FIGURE 1.
FIGURE 1.
Effect of fluid shear stress on osteoblast c-fos, fra-1, fra-2, and fosB/ΔfosB mRNA expression. A, serum-deprived hPOBs were incubated in a parallel plate flow chamber for the indicated times; cells were exposed to laminar flow for the first 20 min (lanes 2–4) or kept under static conditions (lane 1, Sham). At the indicated times, which include the initial 20 min of laminar flow, total cytoplasmic mRNA was isolated, and c-fos, fra-1, fra-2, fosB/ ΔfosB, or gapd mRNA levels were determined by semi-quantitative RT-PCR as described under “Experimental Procedures.” PCR products were separated by nondenaturing agarose gel electrophoresis and visualized by ethidium bromide staining. Sham-treated cells were harvested at 30 min, but similar results were obtained with sham-treated cells harvested at 120 min. B, MC3T3 cells were treated as described for hPOBs in A, but c-fos, fra-1, and fra-2 mRNA levels were quantified by real time RT-PCR and normalized relative to gapd mRNA levels as described under “Experimental Procedures”; the relative mRNA levels found in static controls were assigned a value of 1. p < 0.05 for the comparison between shear-stressed and sham-treated cells for all time points.
FIGURE 2.
FIGURE 2.
Effect of fluid shear stress on osteoblast NO and cGMP production, eNOS and VASP phosphorylation. A, MC3T3 cells were placed in the flow chamber as described in Fig. 1; they were kept either under static conditions (gray bars) or were exposed to laminar flow (black bars) for the indicted times. At the end of flow (or static incubation), cells were kept in the chamber for 3 additional min, and nitrate plus nitrite (NOx) concentrations were measured in the media collected from the chamber. Thus, NOx production was measured over a 3-min interval after the cessation of flow. p < 0.05 was the comparison between shear-stressed and sham-treated cells for the 5- and 20-min time points. B, cells were kept under static conditions for 20 min or were exposed to fluid shear stress for the indicated times, and cell lysates were analyzed by SDS-PAGE/Western blotting using antibodies specific for eNOS phosphorylated on Ser1177 (upper panel) or recognizing eNOS irrespective of its phosphorylation state (lower panel). C, cells were extracted by Dounce homogenization and fractionated by differential centrifugation; cytosolic (Cyto, lane 1) and membrane (Mem, lane 2) fractions were analyzed by SDS-PAGE/Western blotting using antibodies specific for soluble guanylate cyclase β1 subunit (sGC, upper panel), PKG I (middle panel), or PKG II (lower panel). D, cells were placed into the flow chamber and incubated for 15 min in the presence of 0.5 mm IBMX; cells were then either kept under static conditions (gray bars) or were exposed to fluid shear stress (black bars), both in the presence of IBMX. Cells were harvested at the indicated times, and the intracellular cGMP concentration was determined as described under “Experimental Procedures.” E, MC3T3 cells expressing human VASP were treated as described in B, but Western blots were probed with antibodies specific for VASP phosphorylated on Ser239 (upper panel) or α-tubulin (lower panel).
FIGURE 3.
FIGURE 3.
Inhibition of NO/cGMP signaling prevents shear-induced c-fos, fra-1, fra-2, and fosB/ΔfosB mRNA expression. A, serum-deprived hPOBs were placed in a flow chamber and were incubated for 1 h with either culture medium alone (lanes 1 and 2) or with medium containing 4 mm l-NAME (lane 3), 10 μm ODQ (lane 4), or 100 μm (Rp)-8-pCPT-PET-cGMPS ((Rp)-cGMPS, lane 5). Cells were then either kept under static conditions (lane 1) or were exposed to laminar flow for 20 min (lanes 2–5). Ten minutes after the cessation of flow, total RNA was extracted, and c-fos, fra-1, fra-2, fosB/ΔfosB, or gapd mRNA levels were determined by semi-quantitative RT-PCR as described in Fig. 1A. B, MC3T3 cells were treated as described for hPOBs in A, but c-fos, fra-1, and fra-2 mRNA levels were quantified after 60 min by real time RT-PCR as described in Fig. 1B. p < 0.05 for the comparison between control cells receiving no drug and cells treated with l-NAME (L-N), ODQ, or (Rp)-cGMPS (Rp). C, MC3T3 cells were kept under static conditions (gray bars) or were exposed to laminar flow for 20 min (black bars); 5 min after the cessation of flow, media were collected from the chamber, and nitrate plus nitrite (NOx) concentrations were measured. D, MC3T3 cells expressing human VASP were incubated for 1 h with medium alone (lanes 1 and 2) or with medium containing 4 mm l-NAME (lane 3), 10 μm ODQ (lane 4), or 100 μm (Rp)-8-pCPT-PET-cGMPS (Rp-cGMPS, lane 5). Cells were kept under static conditions (lane 1) or were exposed to 20 min of fluid shear stress (lanes 2–5), and 10 min after the cessation of flow, cell lysates were analyzed by SDS-PAGE/Western blotting using antibodies specific for VASP phosphorylated on Ser239 (upper panel) or α-tubulin (lower panel).
FIGURE 4.
FIGURE 4.
cGMP partly mimics the effects of fluid shear stress on osteoblast c-fos, fra-1, fra-2, and fosB/ ΔfosB mRNA expression. A, serum-deprived hPOBs were incubated for 1 h in the absence (lanes 1–4) or presence of 100 μm (Rp)-8-pCPT-PET-cGMPS (Rp-cGMPS, lanes 5 and 6) before adding 50 μm 8-pCPT-cGMP (cGMP) to all cells for the indicated times. c-fos, fra-1, fra-2, fosB/ΔfosB or gapd mRNA levels were determined by semi-quantitative RT-PCR as described in Fig. 1A. B, MC3T3 cells were incubated in the absence (black bars) or presence (gray bars) of (Rp)-8-pCPT-PET-cGMPS and then stimulated with 8-pCPT-cGMP as described in A for hPOBs, but c-fos, fra-1, and fra-2 mRNA levels were quantified by real time RT-PCR. Relative mRNA levels (normalized to gapd) measured in mock-treated cells were assigned a value of 1. p < 0.05 for the comparison between cells treated with (Rp)-cGMPS plus cGMP versus cGMP alone for all time points. C, hPOBs were preincubated in the absence (lanes 1 and 2) or presence (lane 3) of 100 μm (Rp)-8-pCPT-PET-cGMPS for 1 h and treated with 50 μm 8-pCPT-cGMP (lanes 2 and 3) for 30 min. VASP phosphorylation on Ser259 was assessed using a phosphorylation site-specific antibody; a duplicate Western blot was probed with an anti-α-tubulin antibody. D, MC3T3 cells were treated for 1 h with 10 μm sodium nitroprusside, and c-fos, fra-1, and fra-2 mRNA levels were quantified by real time RT-PCR. E, MC3T3 cells were treated for 1 h with either cGMP (100 μm 8-pCPT-cGMP), calcium ionophore (0.3 μm A23187), or both agents, and fos family gene expression was measured as in B.
FIGURE 5.
FIGURE 5.
Effect of siRNA-mediated PKG I or PKG II knockdown on shear- and cGMP-induced c-fos, fra-1, fra-2, and fosB/ΔfosB mRNA expression. MC3T3 cells were transfected with siRNAs specific for GFP (control), or received siRNAs targeting sequences in PKG I (siRNA PKG-1) or PKG II (siRNAs PKG-2a and -2b) as described under “Experimental Procedures.” A, at 48 h after transfection, mRNA levels of PKG I (black bars) and PKG II (gray bars) were quantified by real time PCR; levels were normalized to gapd mRNA, which was not affected by any of the siRNAs. Relative PKG mRNA levels measured in GFP (control) siRNA-transfected cells were assigned a value of 100%. *, p < 0.05 for the comparison between control siRNA and PKG siRNA-treated cells. B, in parallel experiments, cells were extracted by Dounce homogenization and fractionated by differential centrifugation; cytosolic fractions (upper two panels) and membrane fractions (lower two panels) were analyzed by SDS-PAGE/Western blotting using an antibody specific for the C terminus of PKG I common to PKG Iα and Iβ (upper panel), an anti-α-tubulin antibody (2nd panel), an antibody specific for PKG II (3rd panel), and an anti-β3 integrin antibody (lowest panel). C, siRNA-transfected cells were fractionated as described in B, and PKG activity was determined in the membrane fractions as described under “Experimental Procedures.” *, p < 0.05 for the comparison between control siRNA and PKG siRNA-treated cells. D, cells transfected with the siRNAs targeting GFP, PKG I, or PKG II (PKG-2a siRNA) were kept either under static conditions or were subjected to fluid shear stress for 20 min. Cells were harvested 60 min after the onset of flow, and c-fos, fra-1, and fra-2 mRNA levels were determined by quantitative RT-PCR; relative mRNA levels (normalized to gapd) measured in GFP siRNA-transfected static control cells were assigned a value of 1. E, cells transfected with the indicated siRNAs were either mock-treated or were treated with 50μm 8-pCPT-cGMP for 1 h, and c-fos, fra-1, or fra-2 mRNA levels were determined by quantitative RT-PCR. Relative mRNA levels (normalized to gapd) measured in GFP siRNA-transfected mock-treated cells were assigned a value of 1. *, p < 0.05 for the comparison between GFP and PKG II siRNA-treated cells (D and E).
FIGURE 6.
FIGURE 6.
Rescue of PKG II siRNA-transfected cells with a virus encoding siRNA-resistant PKG II. A, MC3T3 cells were transfected with either GFP siRNA or the mouse PKG II-specific siRNA (PKG-2b), and 24 h later, cells were infected with either control virus encoding β-galactosidase (LacZ) or virus encoding siRNA-resistant rat PKG II as indicated. Forty eight hours later, cells were either mock-treated or were treated with 8-pCPT-cGMP for 1 h, and fos family gene expression was determined as described in Fig. 5E. *, p < 0.05 for the comparison between GFP versus PKG II siRNA-treated cells infected with LacZ virus and the comparison between PKG II siRNA-treated cells infected with LacZ versus PKG II virus. B, cells were transfected with GFP siRNA (lanes 1, 2, 5, and 6) or PKG-2b siRNA (lanes 3, 4, 7, and 8) and were infected with LacZ virus (odd lanes) or PKG II virus (even lanes) as described in A. Levels of endogenous murine PKG II and virally expressed rat PKG II were examined by Western blotting of membrane and cytosolic proteins.
FIGURE 7.
FIGURE 7.
Induction of c-fos, fra-1, and fra-2 mRNA expression by fluid shear stress is MEK/Erk-dependent. A, serum-deprived MC3T3 cells were kept under static conditions for 30 min (sham-treated, lane 1) or were subjected to laminar flow for 5 min (lane 2), 10 min (lane 3), or 20 min (lanes 4 and 5); cells in lane 5 were kept in the flow chamber for an additional 10 min after the 20- min exposure to flow. Cell lysates were analyzed by Western blotting using a phospho-Erk1/2-specific antibody (clone E-4, upper panel); duplicate blots were probed with an antibody recognizing Erk1/2 irrespective of their phosphorylation state (lower panel). The bar graph below summarizes results of three independent experiments; phospho-Erk1 bands were scanned, and the intensity of the band found in sham-treated cells was assigned a value of 1. B, serum-deprived MC3T3 cells were preincubated for 1 h in the flow chamber under static conditions with either culture medium alone or with medium containing 10 μm U0126 or 10 μm SB203580, and cells were exposed to laminar flow for 10 min; Erk phosphorylation was assessed as described in A, with phospho-Erk levels in shear-stressed cells incubated with media alone assigned a value of 100%. C, cells were treated as described in B; they were exposed to laminar flow for 20 min and were harvested 10 min later for determination of c-fos, fra-1, fra-2, and gapd mRNA levels by quantitative RT-PCR, as described in Fig. 1B. *, p < 0.05 for the comparison between cells treated with U0126 (U) versus control cells receiving no drug (in B and C). S, SB203580.
FIGURE 8.
FIGURE 8.
Fluid shear stress-induced Erk activation requires NO/cGMP/PKG II signaling. MC3T3 cells were serum-deprived for 24 h prior to the indicated treatments, and Erk phosphorylation was assessed as described in Fig. 7. A, cells were treated for 1 h with 4 mm l-NAME, 10 μm ODQ, or 100 μm (Rp)-8-pCPT-PET-cGMPS (Rp-cGMPS) as indicated, prior to a 10-min exposure to laminar flow (lanes 2–5); cells in lane 1 were kept under static conditions (sham-treated). In the bar graph below, three independent experiments are summarized. p < 0.05 for the comparison between control cells receiving no drug and cells treated with l-NAME, ODQ, or (Rp)-cGMPS. B, cells were transfected with control siRNAs specific for GFP or received siRNAs targeting PKG I (siRNA PKG-1) or PKG II (siRNA PKG-2a) as described in Fig. 5. Cells were either kept under static conditions (–) or were exposed to laminar flow (+) for 10 min. The bar graph summarizes two independent experiments. p < 0.05 for the comparison between cells transfected with PKG-2a siRNA versus GFP siRNA.
FIGURE 9.
FIGURE 9.
NO/cGMP activation of PKG II is sufficient to activate Erk1/2. Erk phosphorylation was assessed in serum-deprived MC3T3 cells as described in Fig. 7A. A, cells were treated with 50 μm 8-pCPT-cGMP for the indicated times. The bar graph summarizes three independent experiments. B, cells were preincubated for 1 h in medium alone or in medium containing 10 μm U0126 or 10 μm SB203580 as indicated, prior to receiving 50 μm 8-pCPT-cGMP (cGMP) for 10 min; phospho-Erk levels in cells treated with cGMP alone were assigned a value of 100%. C, cells were transfected with a control siRNA specific for GFP (lanes 1–4), or an siRNA targeting PKG I (siRNA PKG-1, lanes 5–8), or PKG II (siRNA PKG-2a, lanes 9–12) as described in Fig. 5 and were treated with 50 μm 8-pCPT-cGMP for the indicated times. The bar graph on the right summarizes phospho-Erk1 levels measured in cells treated with cGMP for 5 min; p < 0.05 was used for the comparison between cells transfected with PKG-2a siRNA versus GFP siRNA. D, cells were transfected with either GFP siRNA (lanes 1–4) or the mouse PKG II-specific siRNA PKG-2b (lanes 5–10); 8 h later, cells were infected with control virus (LacZ, lanes 1, 2, 5, and 6), virus encoding siRNA-resistant rat PKG II (lanes 3, 4, 7, and 8), or virus encoding PKG I (lanes 9 and 10). Forty eight hours later, cells were treated with 8-pCPT-cGMP for 10 min. The bar graph on the right summarizes cGMP-induced phospho-Erk1 levels; *, p < 0.05 for the comparison between LacZ and PKG II virus-infected cells transfected with PKG-2a siRNA.
FIGURE 10.
FIGURE 10.
NO/cGMP and calcium signaling in osteoblast mechanotransduction. Osteoblast exposure to fluid shear stress leads to a rapid increase in intracellular calcium through activation of mechanosensitive and voltage-gated calcium channels (MSCC and VGCC, respectively), and possibly through calcium release from intracellular stores (17, 54, 62, 63, 69). An initial burst of NO synthesis may require calcium activation of NO synthase (NOS), but sustained NO synthesis is calcium-independent and may involve activation of NO synthase by phosphorylation (57, 59). NO activates sGC and the resulting cGMP activates membrane-bound PKG II, which phosphorylates substrates leading to activation of the MEK/Erk pathway. The MEK/Erk pathway increases transcription of c-fos, fra-1, fra-2, and fosB/ΔfosB through the following: (i) RSK-mediated phosphorylation and activation of the CREB; (ii) direct phosphorylation of Elk that forms a complex with and activates serum-response factor (SRF); and (iii) recruitment of AP-1 (Fos/Jun) complexes to the promoters (79). Calcium activates the MEK/Erk pathway through Ras/Raf activation of MEK, and can directly activate CREB through calmodulin-dependent protein kinase (CamK) (89). Inhibitors used in this study are indicated in gray. BAPTA-AM, 1,2-bis(2-aminophenoxy)ethane-N,N,N,N′-tetraacetic acid.

References

    1. Hughes-Fulford, M. (2004) Sci. STKE 2004, RE12 - PubMed
    1. Ehrlich, P. J., and Lanyon, L. E. (2002) Osteoporos. Int. 13 688–700 - PubMed
    1. Orr, A. W., Helmke, B. P., Blackman, B. R., and Schwartz, M. A. (2006) Dev. Cell 10 11–20 - PubMed
    1. Hillsley, M. V., and Frangos, J. A. (1994) Biotechnol. Bioeng. 43 573–581 - PubMed
    1. Rubin, J., Rubin, C., and Jacobs, C. R. (2006) Gene (Amst.) 367 1–16 - PMC - PubMed

Publication types

MeSH terms

LinkOut - more resources