. 2009 Mar 15;34(6):584-90.
doi: 10.1097/BRS.0b013e318190b914.

Classification of scoliosis deformity three-dimensional spinal shape by cluster analysis

Affiliations

Classification of scoliosis deformity three-dimensional spinal shape by cluster analysis

Ian A F Stokes et al. Spine (Phila Pa 1976). .

Abstract

Study design: Cluster analysis of existing database of spinal shape of patients attending a scoliosis clinic.

Objective: To determine whether patients with scoliosis can be classified into distinct groups by 3-dimensional curve shape.

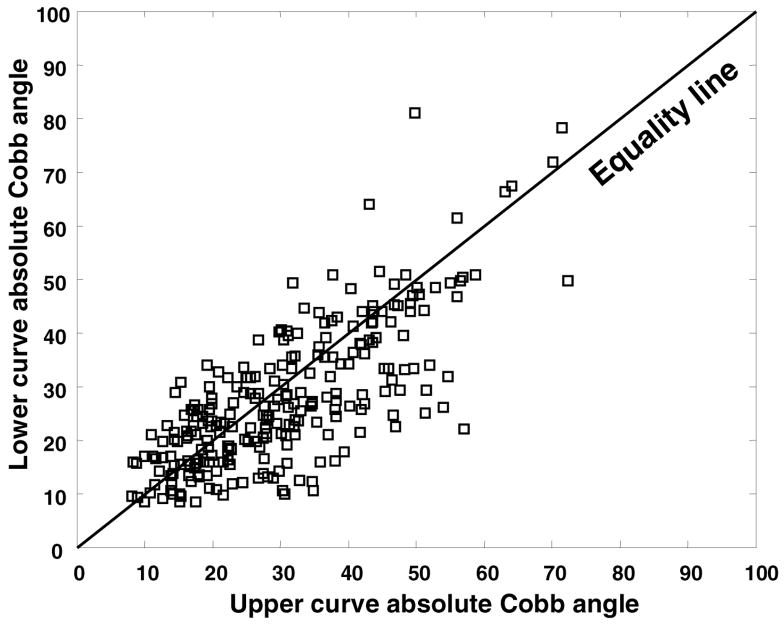
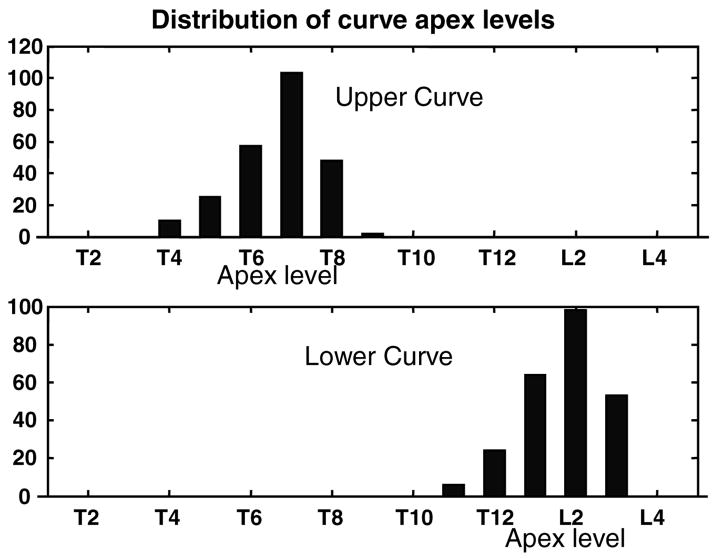
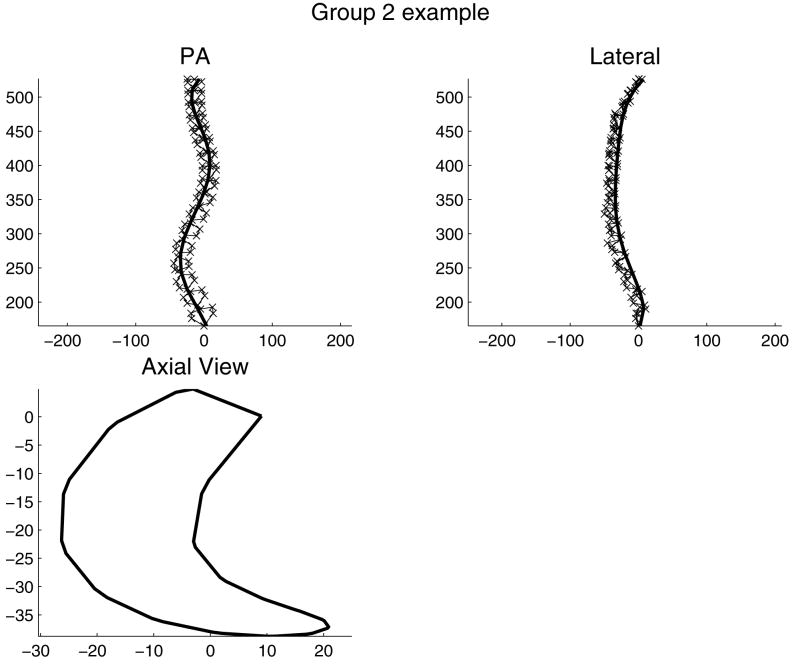
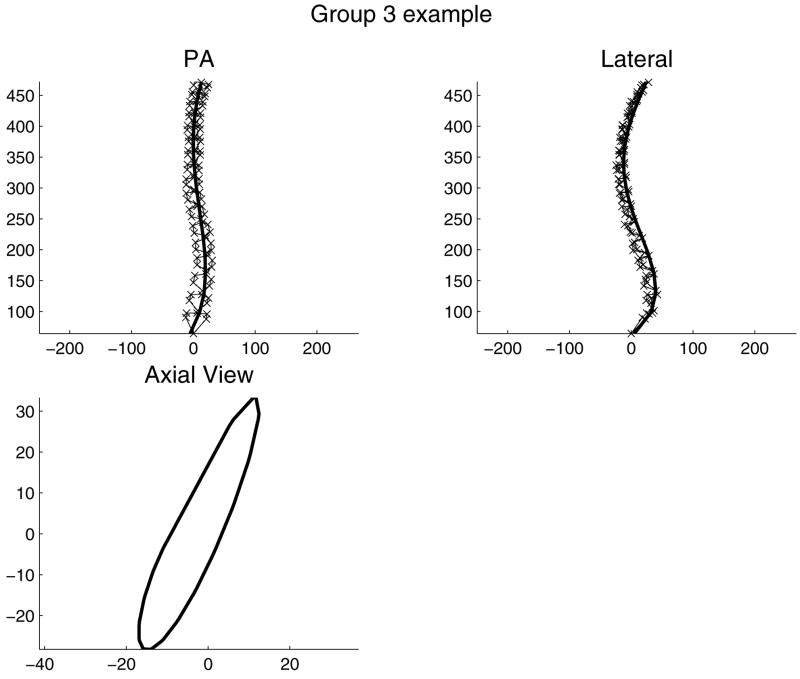
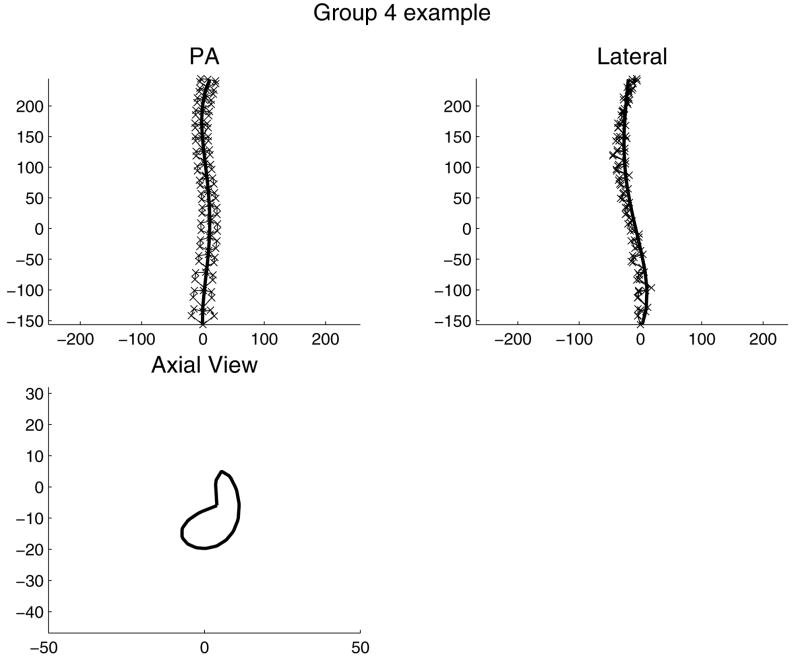
Summary of background data: Subjective or semiquantitative methods can be used to classify curve types in scoliosis, with the goal of rationalizing surgical planning. There are very few reports of using objective methods such as cluster analysis to improve this process. METHODS.: One hundred ten patients who underwent radiography of the spine by a stereo technique, at a scoliosis clinic in the period between 1982 and 1990, were studied. Fifty-six were studied longitudinally (average 3.4 clinic visits each), providing 245 total observations. Selected patients had 2 scoliosis curves with apex between T4 and L3, and both Cobb angles >9 degrees by an automated measurement. The 3-dimensional spinal shape was reconstructed from stereoradiographs. Each curve was quantified by its Cobb angle, apex level, apex vertebra rotation, and rotation of the plane of maximum curvature (PMC) (8 variables). Cluster analysis classified each patient at each visit by these variables.

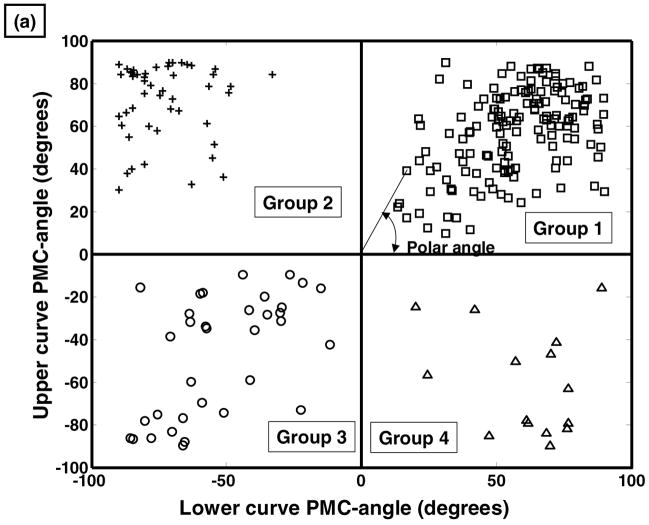
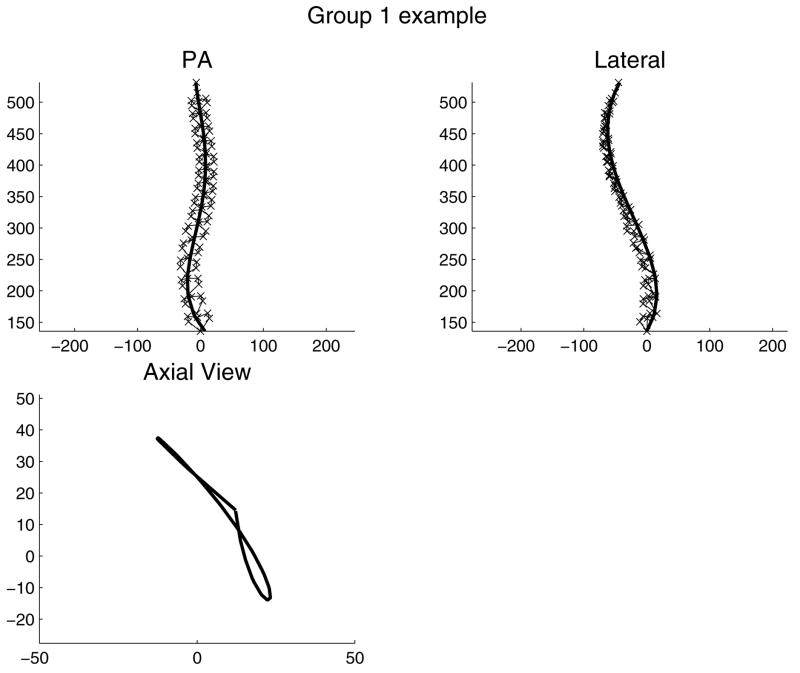
Results: When the analysis searched for 4 clusters, the largest cluster (148 of 245 observations) was the pattern having counterclockwise rotation of the PMC of both curves (typically, a right upper scoliosis curve with kyphosis and left lower scoliosis curve with lordosis). The other 3 clusters (48, 34, and 15 observations) were the other permutations of these variables. Substantial overlap of all the other variables between groups was observed. Of the 56 patients seen longitudinally, 25 were consistently grouped at all clinic visits.

Conclusion: Spinal shape of patients in a clinic population with 2 scoliosis curves form distinct groups according to the 4 permutations of the signs of the rotations of the PMC in 2 curve regions. The pattern can change with repeated observation, often because a slight curvature in the sagittal plane can change because of postural variation and measurement errors. Overlap of the other curve-shape variables between groups suggests that these spinal deformity classifications alone should not determine treatment strategy.


Figures

Figure 1
Figure 1
Scatter plot of the lower versus the upper Cobb angles (absolute values). In the King et al. classification, the relative magnitudes of the Cobb angles can be used to distinguish between Type 1 and Type 2 (King 1 requires lower curve Cobb angle > thoracic - i.e. above the equality line in the scatterplot.)
Figure 2
Figure 2
Histogram of the distribution of levels of scoliosis curve apices.
Figure 3
Figure 3
Spinal shape measurements of each patient that were used in the cluster analysis. The Figure shows the classic pattern having right thoracic scoliosis in a kyphotic region, and left lower scoliosis curve in a lordotic region. This produces a Plane of Maximum Curvature (PMC) in the curve region that is rotated from the sagittal plane in a direction counter-clockwise as viewed from above. This was considered as a positive rotation in the present study. The normally observed rotation of the apical vertebra is clockwise (negative) in the upper curve region (counter to the PMC rotation) and counter-clockwise (positive) in the lower curve region. (Adapted from Stokes et al. [5])
Figure 4
Figure 4
(a) Scatter plot of the angle of plane of maximum curvature of the upper curve, versus the angle of plane of maximum curvature lower curve. The cluster analysis identified distinct groups in each of the four quadrants of this graph. The location of any observation on this graph can be identified by the ‘polar angle’. (b) histogram of the polar angles, demonstrating distinct differences between the four groups.
Figure 4
Figure 4
(a) Scatter plot of the angle of plane of maximum curvature of the upper curve, versus the angle of plane of maximum curvature lower curve. The cluster analysis identified distinct groups in each of the four quadrants of this graph. The location of any observation on this graph can be identified by the ‘polar angle’. (b) histogram of the polar angles, demonstrating distinct differences between the four groups.
Figure 5
Figure 5
Illustrative example of a patient’s spinal shape in Group 1. ‘x’ = each of six landmarks (vertebral endplate centers and bases of pedicles) on each of 17 vertebrae (omitted from axial view for clarity). Solid line: a smoothed line fitted to the positions of landmarks at vertebral endplate centers. This spinal shape was classified as Group 1 because the combination of right upper scoliosis curve with kyphosis, and left lower curve with lordosis provided the positive rotations of both planes of maximum curvature in the two respective scoliosis curve regions.
Figure 6
Figure 6
Illustrative example of a patient’s spinal shape in Group 2. ‘x’ = each of six landmarks (vertebral endplate centers and bases of pedicles) on each of 17 vertebrae (omitted from axial view for clarity). Solid line: a smoothed line fitted to the positions of landmarks at vertebral endplate centers. This spinal shape was classified as Group 2 because the combination of right upper scoliosis curve with kyphosis, and left lower curve with kyphosis provided the positive and negative rotations of the two planes of maximum curvature in the two respective scoliosis curve regions.
Figure 7
Figure 7
Illustrative example of a patient’s spinal shape in Group 3. ‘x’ = each of six landmarks (vertebral endplate centers and bases of pedicles) on each of 17 vertebrae (omitted from axial view for clarity). Solid line: a smoothed line fitted to the positions of landmarks at vertebral endplate centers. This spinal shape was classified as Group 3 because the combination of left upper scoliosis curve with kyphosis, and right lower curve with lordosis provided the negative rotations of both planes of maximum curvature in the two respective scoliosis curve regions.
Figure 8
Figure 8
Illustrative example of a patient’s spinal shape in Group 4. ‘x’ = each of six landmarks (vertebral endplate centers and bases of pedicles) on each of 17 vertebrae (omitted from axial view for clarity). Solid line: a smoothed line fitted to the positions of landmarks at vertebral endplate centers. This spinal shape was classified as Group 4 because the combination of left upper scoliosis curve with kyphosis, and right lower curve with kyphosis provided the negative and positive rotations of the two planes of maximum curvature in the two respective scoliosis curve regions.

References

    1. King HA, Moe JH, Bradford DS, Winter RB. The selection of fusion levels in thoracic idiopathic scoliosis. J Bone Joint Surg. 1983;65:1302–1313. - PubMed
    1. Lenke LG, Betz RR, Harms J, et al. Adolescent idiopathic scoliosis: a new classification to determine extent of spinal arthrodesis. J Bone Joint Surg Am. 2001;83:1169–81. - PubMed
    1. Stokes IA, Aronsson DD. Computer-assisted algorithms improve reliability of King classification and Cobb angle measurement of scoliosis. Spine. 2006;31(6):665–670. - PubMed
    1. Duong L, Chariet F, Labelle H. Three-dimensional classification of spinal deformities using fuzzy clustering. Spine. 2006;31(8):923–930. - PubMed
    1. Stokes IAF, Bigalow LC, Moreland MS. Three-dimensional spinal curvature in idiopathic scoliosis. J Orthop Res. 1987;5:102–113. - PubMed

Publication types

MeSH terms