. 2009 Mar;5(3):e1000335.
doi: 10.1371/journal.ppat.1000335. Epub 2009 Mar 13.

Caspar controls resistance to Plasmodium falciparum in diverse anopheline species

Affiliations

Caspar controls resistance to Plasmodium falciparum in diverse anopheline species

Lindsey S Garver et al. PLoS Pathog. 2009 Mar.

Abstract

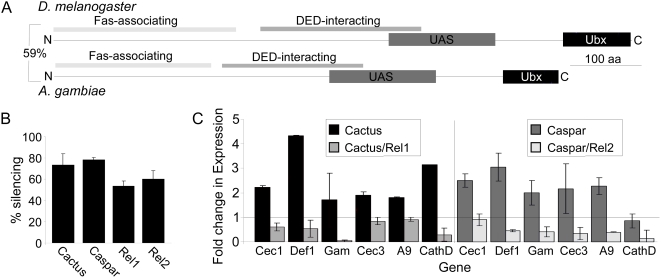
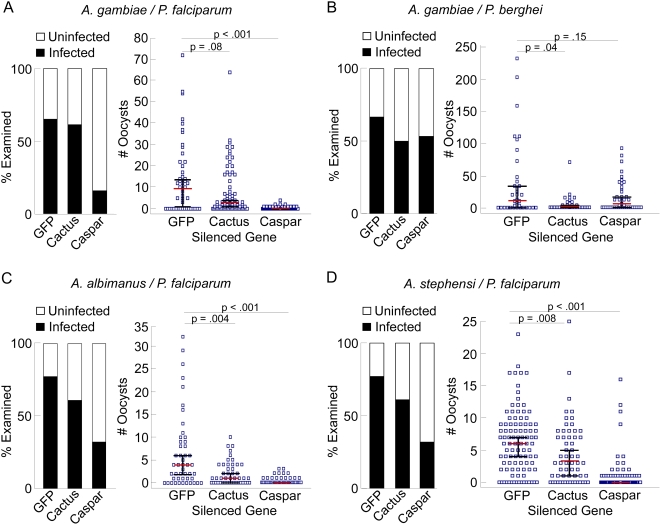
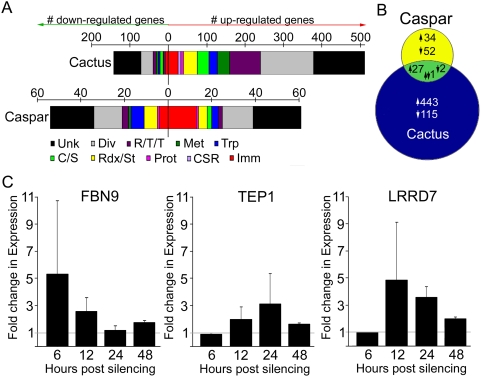
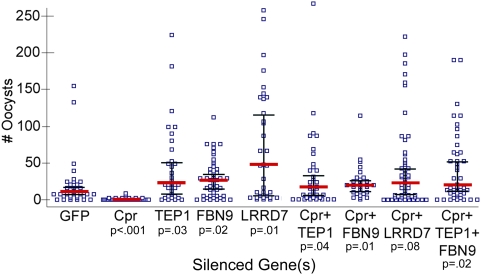
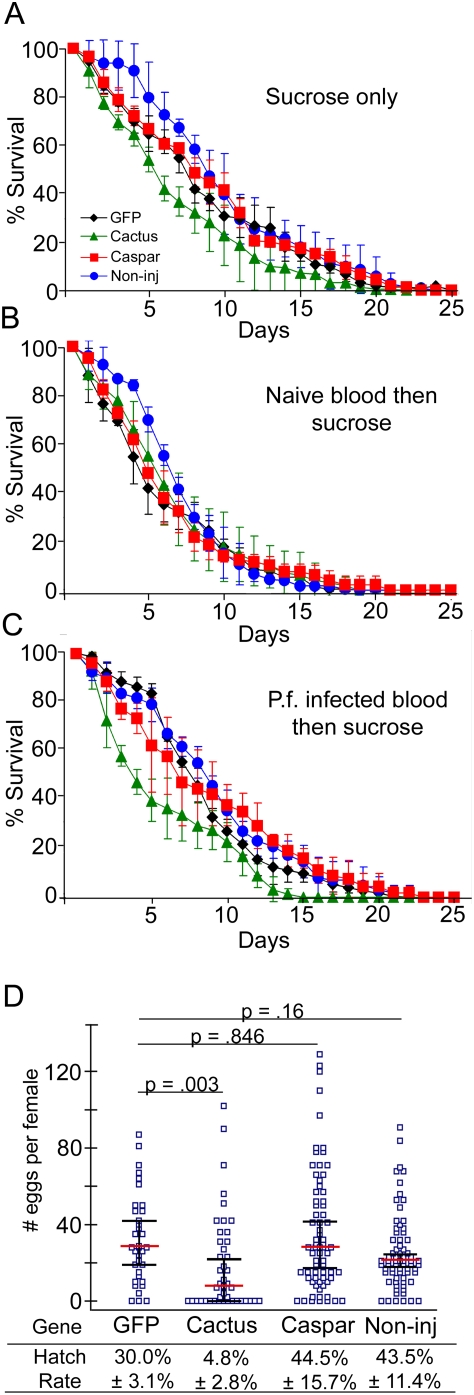
Immune responses mounted by the malaria vector Anopheles gambiae are largely regulated by the Toll and Imd (immune deficiency) pathways via the NF-kappaB transcription factors Rel1 and Rel2, which are controlled by the negative regulators Cactus and Caspar, respectively. Rel1- and Rel2-dependent transcription in A. gambiae has been shown to be particularly critical to the mosquito's ability to manage infection with the rodent malaria parasite Plasmodium berghei. Using RNA interference to deplete the negative regulators of these pathways, we found that Rel2 controls resistance of A. gambiae to the human malaria parasite Plasmodium falciparum, whereas Rel 1 activation reduced infection levels. The universal relevance of this defense system across Anopheles species was established by showing that caspar silencing also prevents the development of P. falciparum in the major malaria vectors of Asia and South America, A. stephensi and A. albimanus, respectively. Parallel studies suggest that while Imd pathway activation is most effective against P. falciparum, the Toll pathway is most efficient against P. berghei, highlighting a significant discrepancy between the human pathogen and its rodent model. High throughput gene expression analyses identified a plethora of genes regulated by the activation of the two Rel factors and revealed that the Toll pathway played a more diverse role in mosquito biology than the Imd pathway, which was more immunity-specific. Further analyses of key anti-Plasmodium factors suggest they may be responsible for the Imd pathway-mediated resistance phenotype. Additionally, we found that the fitness cost caused by Rel2 activation through caspar gene silencing was undetectable in sugar-fed, blood-fed, and P. falciparum-infected female A. gambiae, while activation of the Toll pathway's Rel1 had a major impact. This study describes for the first time a single gene that influences an immune mechanism that is able to abort development of P. falciparum in Anopheline species. Further, this study addresses aspects of the molecular, evolutionary, and physiological consequences of the observed phenotype. These findings have implications for malaria control since broad-spectrum immune activation in diverse anopheline species offers a viable and strategic approach to develop novel malaria control methods worldwide.


Conflict of interest statement

The authors have declared that no competing interests exist.

Figures

Figure 1
Figure 1. Identification and validation of AgCaspar.
(A) Domain comparison between Drosophila Caspar (upper diagram) and Anopheles Caspar (lower diagram). The horizontal black bar represents the amino acid sequence; black, gray, and white boxes indicate four functional domains of Caspar. Percentage indicates the degree of sequence similarity. DED, death effector domain; UAS, ubiquitin-associated domain; Ubx, ubiquitin-like domain. (B) Silencing efficiency of caspar, cactus, rel1, and rel2. Bars represent the percent knockdown compared to controls treated with dsRNA against GFP as determined by qRT-PCR. Error bars represent standard deviation of three independent assays. (C) Expression of genes following single or double knockdown in adults. Bars represent fold change in expression compared to GFP dsRNA–treated controls. Horizontal gray line represents baseline expression (i.e., a 1∶1 expression ratio between control and silenced samples). Silencing treatment is indicated by the legend. Error bars represent standard deviation across three biological replicates. Cec1, cecropin1; Def1, defensin1; Gam, gambicin; Cec3, cecropin3; A9, ClipA9; CathD, cathepsinD.
Figure 2
Figure 2. Plasmodium infection of Caspar and Cactus-deficient mosquitoes.
Prevalence and infection intensity as a measure of P. falciparum oocysts in A. gambiae (A), P. berghei oocysts in A. gambiae (B), P. falciparum oocysts in A. albimanus (C), and in A. stephensi (D). For all, the left panel indicates infection prevalence where the bars represent the total population of mosquitoes examined. The filled portion of the bars indicates the proportion of mosquito midguts that stained positive for at least one oocyst; the open portion of the bar indicates the proportion of midguts that were uninfected. The right panel indicates intensity of infection where blue squares represent individual midgut oocyst counts in mosquitoes receiving RNAi treatment against the given genes; the red bars represent the median number of oocysts per midgut, and the black bars indicate the 95% confidence interval.
Figure 3
Figure 3. Molecular analysis of caspar and cactus silencing.
(A) Graph indicating functional group distribution of genes regulated by cactus and caspar silencing. For both upper (Cactus) and lower (Caspar) diagrams, colored sections of graphs correspond to the number of genes either up-regulated (right of zero) or down-regulated (left of zero) for the given functional group (see legend). Unk, unknown; Div, diverse; R/T/T, replication/transcription/translation; Met, metabolism; Trp, transport; C/S, cytoskeletal/structure; Rdx/St, redox/stress; Prot, proteolysis and digestion; CSR, chemosensory; Imm, immunity. Functional groups were predicted using Gene Ontology terms . (B) Venn diagram indicating comparative gene regulation between the two treatment groups. The blue and yellow circles represent the gene expression profiles of the cactus- and caspar-silenced mosquitoes, respectively, with the overlapping region (green) representing genes that were regulated by both treatments. Numbers with upward-pointing arrows indicate the number of induced genes, numbers with downward-pointing arrows indicate the number of repressed genes, and the single number with one downward-facing and one upward-facing arrow represents the one gene that was enriched after cactus silencing and repressed after caspar silencing. (C) Temporal expression analysis of anti-Plasmodium gene after Caspar depletion. Bars reflect fold change in expression of the indicated gene at 6, 12, 24, and 48 hours after injection of dsRNA against caspar. Fold change is determined by real-time quantitative PCR comparison to GFP dsRNA–treated controls. Horizontal gray line represents baseline expression (i.e., a 1∶1 expression ratio between control and silenced samples), and error bars indicate standard deviation among three biological replicates. P-values were ≤.05 for: FBN9 at 12 and 48 h.p.i.; TEP1 at 48 h.p.i.; LRRD9 at 6, 24, and 48 h.p.i. Other time points are indicative of trends but did not reach statistical significance among three replicates.
Figure 4
Figure 4. Infection intensities following simultaneous silencing of caspar and effector genes.
Blue squares represent individual oocyst counts following the indicated RNAi treatment; horizontal red bars represent median number of oocysts per gut, and black bars represent the 95% confidence interval. Assays represent three independent biological replicates and were subject to Mann-Whitney statistical tests. P-values appear below each treatment and refer to that treatment compared to the GFP control. Cpr, Caspar.
Figure 5
Figure 5. Fitness of caspar- and cactus-silenced mosquitoes.
(A–C) Longevity: Symbols represent the percent of surviving mosquitoes after RNAi-mediated silencing of genes: Caspar (red squares) or Cactus (green triangles); GFP dsRNA treated control (black diamonds), the non-injected control is indicated by the blue circles. The error bars represent the standard deviation for three independent assays. (A) Mosquitoes maintained on 10% sucrose solution; (B) Mosquitoes given a single naïve blood meal via membrane and maintained on 10% sucrose subsequently; (C) Mosquitoes given a single P. falciparum–infected blood meal via membrane and maintained on 10% sucrose subsequently. (D) Fecundity: Blue squares represent number of eggs laid by a single female (that received RNAi treatment against the given genes) after a single blood meal; the red horizontal bars represent the median number of eggs laid per female, and black bars represent the 95% confidence interval. Data was subject to Mann-Whitney statistical tests, and plots include data from three independent biological replicates. Hatch rates indicate the average percentage of eggs giving rise to 2nd/3rd instar larvae as determined by three biological replicates. Standard deviations derived from these replicates are given as ±. P.f., P. falciparum; Non-inj, non-injected.

References

    1. Meister S, Koutsos AC, Christophides GK. The Plasmodium parasite—a ‘new’ challenge for insect innate immunity. Int J Parasitol. 2004;34:1473–82. - PubMed
    1. Michel K, Kafatos FC. Mosquito immunity against Plasmodium. Ins Biochem Mol Biol. 2005;35:677–689. - PubMed
    1. Christophides GK, Zdobnov E, Barillas-Mury C, Birney E, Blandin S, et al. Immunity-related genes and gene-families in Anopheles gambiae. Science. 2002;298:159–165. - PubMed
    1. Meister S, Kanzok SM, Zheng XL, Luna C, Li TR, et al. Immune signaling pathways regulating bacterial and malaria parasite infection of the mosquito Anopheles gambiae. Proc Natl Acad Sci U S A. 2005;102:11420–11425. - PMC - PubMed
    1. Frolet C, Thoma M, Blandin S, Hoffmann JA, Levashina EA. Boosting NF-kappaB-dependent basal immunity of Anopheles gambiae aborts development of Plasmodium berghei. Immunity. 2006;25:677–685. - PubMed

Publication types

MeSH terms