Review
. 2009;119(5):691-731.
doi: 10.1080/00207450802325843.

Whole brain size and general mental ability: a review

Affiliations
Review

Whole brain size and general mental ability: a review

J Philippe Rushton et al. Int J Neurosci. 2009.

Abstract

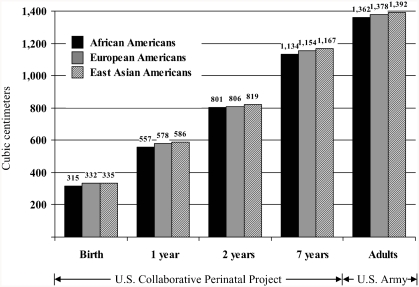
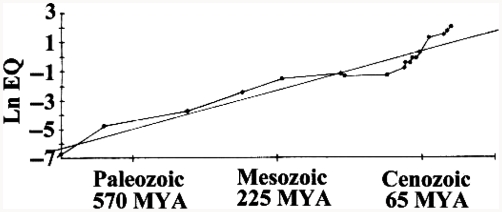
We review the literature on the relation between whole brain size and general mental ability (GMA) both within and between species. Among humans, in 28 samples using brain imaging techniques, the mean brain size/GMA correlation is 0.40 (N = 1,389; p < 10(-10)); in 59 samples using external head size measures it is 0.20 (N = 63,405; p < 10(-10)). In 6 samples using the method of correlated vectors to distill g, the general factor of mental ability, the mean r is 0.63. We also describe the brain size/GMA correlations with age, socioeconomic position, sex, and ancestral population groups, which also provide information about brain-behavior relationships. Finally, we examine brain size and mental ability from an evolutionary and behavior genetic perspective.


Figures

Figure 1
Figure 1
Mean brain weight for 4-year age periods in various subgroups. Brain weight is plotted at midpoint of each age period (e.g., the point at age 6 years represents the average for subjects between 4 and 8 years; White men, open triangles; Black men, solid triangles; White women, open squares; Black women, solid squares). Differences in brain weights among various groups become apparent at age 6 years. (From Ho et al., 1980, p. 636, Figure 2.)
Figure 2
Figure 2
The relation between the ratio of brain mass/body surface area and body surface area in White men and women. Ankney (1992) calculated the ratios by estimating brain mass at a given body surface area using the equations in Ho et al. (1980, Table 3): men, brain mass = 1,077 g (±56) +173 (±31) × body surface area (r = +0.27, p < 0.01); women, brain mass = 949 g (±52) +188 (±32) × body surface area (r = +0.24, p < 0.01). (From Ankney, 1992, p. 331, Figure 1. Copyright 1992 by Ablex Publishing Corp. Reprinted with permission.).
Figure 3
Figure 3
The relation between brain mass and body height in White men and women. Lines drawn from equations in Ho et al. (1980, Table 1): men, brain mass = 920 g (±113) + 2.70 (±0.65) × body height (r = 0.20, p < 0.01); women, brain mass = 748 g (±104) + 3.10 (±0.64) × body height (r = +0.24, p < 0.01). (From Ankney, 1992, p. 333, Figure 4. Copyright 1992 by Ablex Publishing Corp. Reprinted with permission.).
Figure 4
Figure 4
Cranial capacity for a stratified random sample of 6,325 U.S. Army personnel. The data, grouped into six sex-by-race categories, are collapsed across military rank. (East Asian men, closed circles; White men, closed squares; Black men, closed triangles; East Asian women, open circles; White women, open squares; Black women, open triangles). They show that, across the 19 different analyses controlling for body size, men averaged larger cranial capacities than did women, and East Asians averaged larger than did Whites or Blacks. Analysis 1 presents the data unadjusted for body size showing no difference for East Asian and White men. (From Rushton, 1992a, p. 408, Figure 1. Copyright 1992 by Ablex Publishing Corp. Reprinted with permission.).
Figure 5
Figure 5
Mean cranial capacity (cm3) for African Americans, European Americans, and East Asian Americans from birth through adulthood. Data for birth through age 7 years from the U.S. Perinatal Project; data for adults from the U.S. Army data in Figure 4. (From Rushton, 1997, p. 15, Figure 2. Copyright 1997 by Ablex Publishing Corp. Reprinted with permission.).
Figure 6
Figure 6
Average encephalization quotient (EQ; natural log), a measure of neural tissue corrected by body size, plotted against elapsed geologic time in millions of years. (After Russell, 1983).

References

    1. Anderson B. Evidence from the rat for a general factor that underlies cognitive performance and that relates to brain size: Intelligence? Neuroscience Letters. 1993;153:98–102. - PubMed
    1. Andreasen N. C., Ehrhardt J. C., Swayze V. W., Alliger R. J., Yuh W. T. C., et al. Magnetic resonance imaging of the brain in schizophrenia. Archives of General Psychiatry. 1990;47:35–44. - PubMed
    1. Andreasen N. C., Flaum M., Swayze V., O'Leary D. S., Alliger R., Cohen G., et al. Intelligence and brain structure in normal individuals. American Journal of Psychiatry. 1993;150:130–134. - PubMed
    1. Ankney C. D. Sex differences in relative brain size: The mismeasure of woman, too? Intelligence. 1992;16:329–336.
    1. Ankney C. D. Sex differences in brain size and mental ability: Comments on R. Lynn and D. Kimura. Personality and Individual Differences. 1995;18:423–424.

LinkOut - more resources