. 2009 Mar 13:10:107.
doi: 10.1186/1471-2164-10-107.

The complete mitochondrial genome of the house dust mite Dermatophagoides pteronyssinus (Trouessart): a novel gene arrangement among arthropods

Affiliations

The complete mitochondrial genome of the house dust mite Dermatophagoides pteronyssinus (Trouessart): a novel gene arrangement among arthropods

Wannes Dermauw et al. BMC Genomics. .

Abstract

Background: The apparent scarcity of available sequence data has greatly impeded evolutionary studies in Acari (mites and ticks). This subclass encompasses over 48,000 species and forms the largest group within the Arachnida. Although mitochondrial genomes are widely utilised for phylogenetic and population genetic studies, only 20 mitochondrial genomes of Acari have been determined, of which only one belongs to the diverse order of the Sarcoptiformes. In this study, we describe the mitochondrial genome of the European house dust mite Dermatophagoides pteronyssinus, the most important member of this largely neglected group.

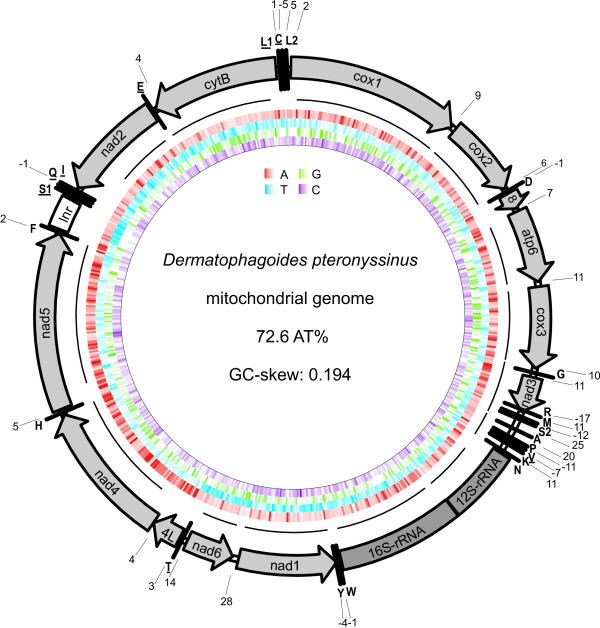
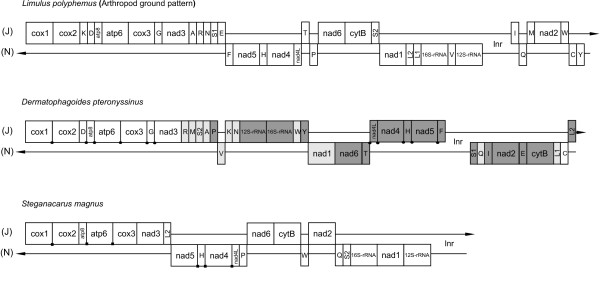
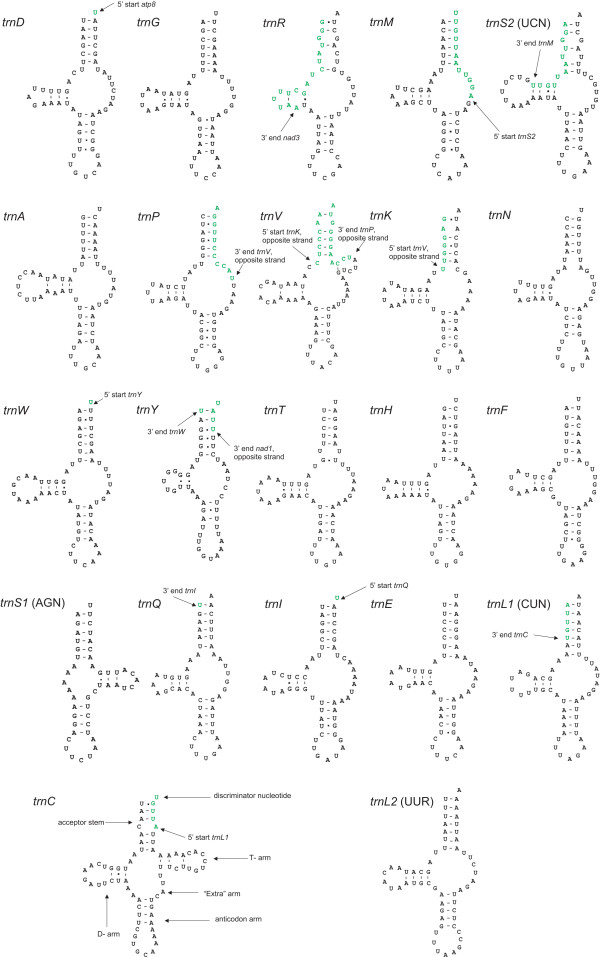
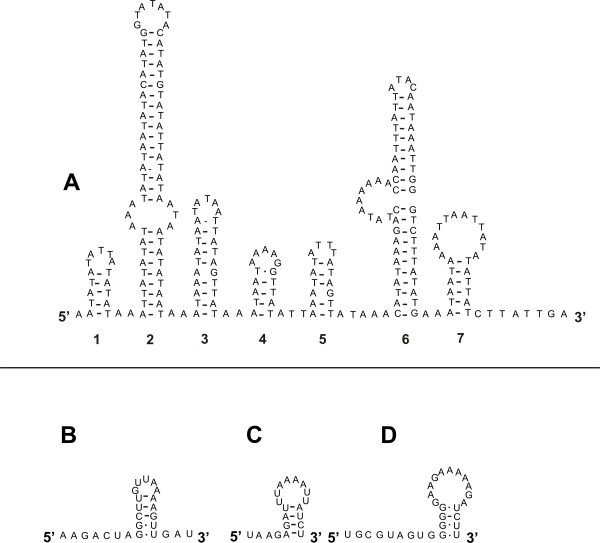
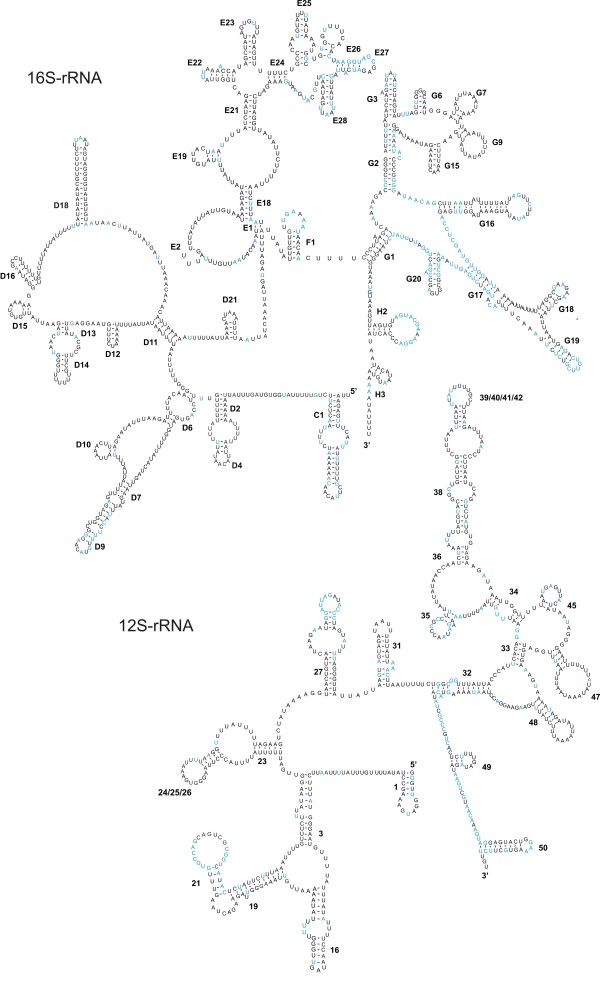
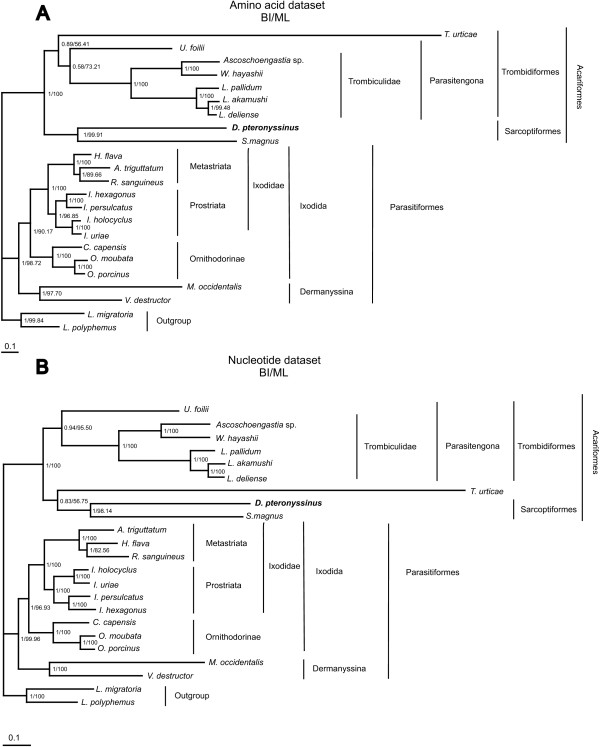
Results: The mitochondrial genome of D. pteronyssinus is a circular DNA molecule of 14,203 bp. It contains the complete set of 37 genes (13 protein coding genes, 2 rRNA genes and 22 tRNA genes), usually present in metazoan mitochondrial genomes. The mitochondrial gene order differs considerably from that of other Acari mitochondrial genomes. Compared to the mitochondrial genome of Limulus polyphemus, considered as the ancestral arthropod pattern, only 11 of the 38 gene boundaries are conserved. The majority strand has a 72.6% AT-content but a GC-skew of 0.194. This skew is the reverse of that normally observed for typical animal mitochondrial genomes. A microsatellite was detected in a large non-coding region (286 bp), which probably functions as the control region. Almost all tRNA genes lack a T-arm, provoking the formation of canonical cloverleaf tRNA-structures, and both rRNA genes are considerably reduced in size. Finally, the genomic sequence was used to perform a phylogenetic study. Both maximum likelihood and Bayesian inference analysis clustered D. pteronyssinus with Steganacarus magnus, forming a sistergroup of the Trombidiformes.

Conclusion: Although the mitochondrial genome of D. pteronyssinus shares different features with previously characterised Acari mitochondrial genomes, it is unique in many ways. Gene order is extremely rearranged and represents a new pattern within the Acari. Both tRNAs and rRNAs are truncated, corroborating the theory of the functional co-evolution of these molecules. Furthermore, the strong and reversed GC- and AT-skews suggest the inversion of the control region as an evolutionary event. Finally, phylogenetic analysis using concatenated mt gene sequences succeeded in recovering Acari relationships concordant with traditional views of phylogeny of Acari.


Figures

Figure 1
Figure 1
Schematic representation of the mt genome of D. pteronyssinus. Except for atp8 (= 8) and nad4 (= 4L) protein coding and ribosomal genes are presented as outlined in the abbreviations section. tRNA genes are abbreviated using the one-letter amino acid code, with L1 = CUN; L2 = UUR; S1 = AGN; S2 = UCN. RNAs on the N-strand are underlined. Numbers at gene junctions indicate the length of small non-coding regions where negative numbers indicate overlap between genes. A-,T-,G- and C-content of the mt genome is represented using a red, blue, green and purple colour graded circle, respectively. Black curved lines on the outside of these circles represent mt genome coverage by Dermatophagoides ESTs (see additional file 5 for sequences of Dermatophagoides ESTs covering the mt genome of D. pteronyssinus).
Figure 2
Figure 2
Restriction digest of rolling circle amplified mitochondrial DNA of D. pteronyssinus. Rolling circle amplified mtDNA, undigested (lane 3) and digested with XmnI (lane2) and EcoRI (lane 4). Molecular marker used was MassRuler DNA ladder Mix (Fermentas) (lane 1).
Figure 3
Figure 3
Mitochondrial gene arrangement of Limulus polyphemus, Dermatophagoides pteronyssinus and Steganacarus magnus. Graphical linearisation of mt genomes is presented according to [32]. Gene sizes are not drawn to scale. J stands for majority and N for minority strand. Protein coding and rRNA genes are abbreviated as in the abbreviations section. tRNA genes are abbreviated using the one-letter amino acid code, with L1 = CUN; L2 = UUR; S1 = AGN; S2 = UCN. White boxes represent genes with the same relative position as in the arthropod ground pattern, L. polyphemus. Light-gray boxes represent genes that changed positions relative to L. polyphemus; dark-gray boxes represent genes that changed both position and orientation. Circular dots between the genes of D. pteronyssinus represent conserved gene boundaries compared to L. polyphemus. Square dots between the genes of S. magnus represent conserved gene boundaries compared to D. pteronyssinus.
Figure 4
Figure 4
Inferred secondary structures of the 22 mitochondrial tRNAs from D. pteronyssinus. tRNAs are shown in the order of occurrence in the mt genome starting from cox1. Locations of adjacent gene boundaries are indicated with arrows. Green font indicates that the sequence is part of the adjacent gene. Inferred Watson-Crick bonds are illustrated by lines, whereas GU bonds are illustrated by dots.
Figure 5
Figure 5
Secondary structures of non-coding regions of the mt genome of D. pteronyssinus. Secondary structure of non-coding regions between (A) trnF and trnS1 (large non-coding region); (B) trnS2 and trnA; (C) trnA and trnP; (D) nad1 and nad6. All structures were constructed using Mfold [103]. Inferred Watson-Crick bonds are illustrated by lines, whereas GU bonds are illustrated by dots.
Figure 6
Figure 6
16S-rRNA and 12S-rRNA secondary structures of the mitochondrial genome of D. pteronyssinus. The numbering of the stem-loops is after de Rijk et al. [75] for 16S-rRNA and after van de Peer et al. [76] for 12S-rRNA. Blue coloured nucleotides show 100% identity when aligned to 12S-rRNA and 16S-rRNA genes from other Acariformes (as listed in Table 1). Inferred Watson-Crick bonds are illustrated by lines, whereas GU bonds are illustrated by dots.
Figure 7
Figure 7
Phylogenetic trees of Acari relationships. Trees were inferred from amino acid (A) and nucleotide (B) datasets. All protein coding gene sequences were aligned and concatenated; ambiguously aligned regions were omitted by Gblocks 0.91b [105]. Trees were rooted with two outgroup taxa (L. polyphemus and L. migratoria). Numbers behind the branching points are percentages from Bayesian posterior probabilities (left) and ML bootstrapping (right). Accession numbers for the different Acari mt genomes are listed in Table 1.

References

    1. Harvey MS. The neglected cousins: What do we know about the smaller Arachnid orders? J Arachnol. 2002;30:357–372.
    1. Acari. The Mites http://tolweb.org/Acari/2554/1996.12.13
    1. Dunlop JA, Alberti G. The affinities of mites and ticks: a review. J Zool Syst Evol Res. 2008;46:1–18.
    1. O'Connor BM. Phylogenetic relationships among higher taxa in the Acariformes, with particular reference to the Astigmata. In: Griffiths DA, Bowman CE, editor. Acarology VI. Vol. 1. Chichester: Ellis-Horwood Ltd; 1984. pp. 19–27.
    1. Spieksma FTM. Domestic mites from an acarologic perspectives. Allergy. 1997;52:360–368. - PubMed

Publication types

MeSH terms

Associated data

LinkOut - more resources