. 2009 Mar 13;2(1):5.
doi: 10.1186/1755-7682-2-5.

Characterization of the epithelial sodium channel alpha subunit coding and non-coding transcripts and their corresponding mRNA expression levels in Dahl R versus S rat kidney cortex on normal and high salt diet

Affiliations

Characterization of the epithelial sodium channel alpha subunit coding and non-coding transcripts and their corresponding mRNA expression levels in Dahl R versus S rat kidney cortex on normal and high salt diet

Marlene F Shehata. Int Arch Med. .

Abstract

Aims/hypothesis: The alpha subunit of the amiloride-sensitive epithelial sodium channel (alpha ENaC) is critical for the expression of functional channels. In humans and rats, non functional alternatively spliced forms of alpha ENaC have been proposed to act as negative regulatory components for ENaC. The purpose of this study was to examine the presence and consequently investigate the mRNA expression levels of alternatively spliced forms of alpha ENaC in kidney cortex of Dahl salt-resistant rats (R) versus Dahl salt-sensitive rats (S) on high salt and normal diets.

Methods: Using quantitative RT-PCR strategy, we examined the mRNA expression levels of previously reported alpha ENaC-a and -b alternatively spliced forms in kidney cortex of Dahl S and R rats on normal and four-week high salt diet and compared their corresponding abundance to wildtype alpha ENaC mRNA levels. We identified 2 novel non-coding C-terminus spliced forms and examined their mRNA expression in Dahl R versus S rat kidney cortex. We also tested the presence of five previously reported lung-specific alpha ENaC spliced forms in Dahl rat kidney cortex (CK479583, CK475461, CK364785, CK475819, and CB690980).

Results: Previously reported alpha ENaC-a and -b alternatively spliced forms are present in Dahl rat kidney cortex and are significantly higher in Dahl R versus S rats (P < 0.05). Four-week high salt diet significantly increases alpha ENaC-b (P < 0.05), but not alpha ENaC-a transcript abundance in Dahl R, but not S rats. Two non-coding alpha ENaC spliced forms -c and -d are newly identified in the present study, whose levels are comparable in Dahl R and S rats. Compared to alpha ENaC-wt, alpha ENaC-a, -c and -d are low abundance transcripts (4 +/- 2, 110 +/- 20, and 10 +/- 2 fold less respectively), in contrast to alpha ENaC-b abundance that exceeds alpha ENaC-wt by 32 +/- 3 fold. We could not identify any of the five previously reported lung-specific alpha ENaC spliced forms (CK479583, CK475461, CK364785, CK475819, and CB690980) in Dahl rat kidney cortex.

Conclusion/interpretation: alpha ENaC alternative splicing might regulate alpha ENaC by the formation of coding RNA species (alpha ENaC-a and -b) and non-coding RNA species (alpha ENaC-c and -d). alpha ENaC-a and -b mRNA levels are significantly higher in Dahl R versus S rats. Additionally, alpha ENaC-b is a salt-sensitive transcript whose levels are significantly higher 4-weeks post high salt diet compared to normal salt diet in Dahl R rats. Among the four alpha ENaC transcripts (-a, -b, -c and -d), alpha ENaC-b is a predominant transcript that exceeds alpha ENaC-wt abundance by ~32 fold. alpha ENaC-a and -b spliced forms, particularly, alpha ENaC-b, might potentially act as dominant negative proteins for ENaC activity, thereby rescuing Dahl R rats from developing salt-sensitive hypertension on high salt diet. On the other hand, non-coding alpha ENaC-c and -d might assist alternative splicing, facilitate RNA processing, or regulate alpha ENaC as well as each other.


Figures

Figure 1
Figure 1
PCR analysis of α ENaC-a, -b, -c and -d variants versus α ENaC-wt in kidney cortex of Dahl S versus R rats on normal and high salt diet. Figure 1A) Specific sense and antisense primers were used for amplifying α ENaC-wt. α ENaC-wt fragment of 325 bp was amplified from kidney cortex of Dahl S and R rats fed normal and high salt diet. Figure 1B) Specific sense primers (missing the 23 bp unique to α ENaC-a) were utilized to amplify α ENaC-a. α ENaC-a fragment of 266 bp was amplified from kidney cortex of Dahl S and R rats fed normal and high salt diets. For a negative control, water without a cDNA template was used and for a positive control, α ENaC-wt primers were utilized to amplify α ENaC-wt fragment of 346 bp. Figure 1C) Specific antisense primers (missing the 79 bp unique to α ENaC-b) were utilized. α ENaC-b fragment of 278 bp was amplified from kidney cortex of Dahl S and R rats fed normal and high salt diet. Figure 1D) Specific primers for α ENaC-c were used to amplify a fragment of 59 bp. α ENaC-c was amplified from kidney cortex of Dahl S and R rats fed normal and high salt diet. Figure 1E) Specific primers for α ENaC-d were used to amplify a fragment of 99 bp. α ENaC-d was amplified from kidney cortex of Dahl S and R rats fed normal and high salt diet. C (Control): water without cDNA template; wt: wildtype α ENaC primers; H: High salt diet; N: Normal salt diet. The sizes of the expected PCR products are indicated.
Figure 2
Figure 2
Schematic representation of novel α ENaC alternatively spliced forms (-c and -d). A) A schematic illustration of the mRNA sequences of α ENaC-c and -d forms. α ENaC-c and -d are small non-coding RNA. α ENaC-c is composed of portions of exon VII, IX and XII, while that of α ENaC-d is formed of a portion of exon XII and an intronic fragment. B) The genomic sequence of α ENaC-c and -d forms. α ENaC-c share the same splicing site (CCTGGG) with α ENaC-a and -b spliced forms, which is located within exon VII. α ENaC-c and -d are made up of 59 and 99 bases respectively.
Figure 3
Figure 3
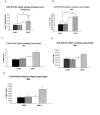
Quantitative RT-PCR analysis of RNA expression of α ENaC-wt and the alternatively spliced forms -a, -b, -c and -d in kidney cortex of Dahl S and R rats fed normal and high salt diet. Figure 3A) Specific primers for α ENaC-wt were used to amplify cDNAs from kidney cortex of Dahl S and R rats on normal and high salt diet. A significant increase (P < 0.05) in α ENaC-wt expression was observed in Dahl R versus S rats. No significant dietary impact on the expression levels of α ENaC-wt was noticed in Dahl S or R rats. Figure 3B) Specific primers unique to α ENaC-a were used to amplify cDNAs from kidney cortex of Dahl S and R rats on normal and high salt diet. A significant increase (P < 0.05) in α ENaC-a expression was observed in Dahl R versus S rats. No significant dietary impact on the expression levels of α ENaC-a was noticed in Dahl S or R rats. Figure 3C) Specific primers unique to α ENaC-b were used to amplify cDNAs from kidney cortex of Dahl S and R rats on normal and high salt diet. A significant increase (P < 0.05) in α ENaC-b expression was observed in Dahl R versus S rats. Additionally, a significant increase in the expression levels of α ENaC-b was observed on high versus normal salt diet in Dahl R, but not S rats. Figure 3D) Specific primers unique to α ENaC-c were used to amplify cDNAs from kidney cortex of Dahl S and R rats on normal and high salt diet. Only a slight, insignificant increase in α ENaC-c expression was observed in Dahl R versus S rats. No significant dietary impact on the expression levels of α ENaC-c was noticed in Dahl S or R rats. Figure 3E) Specific primers unique to α ENaC-d were used to amplify cDNAs from kidney cortex of Dahl S and R rats on normal and high salt diet. Only a slight, insignificant increase in α ENaC-a expression was observed in Dahl R versus S rats. α ENaC-a, -c and -d are lower abundant transcripts. Only α ENaC-b exceeded α ENaC-wt expression by ~32 fold. Bars represent mean +/- SEM, *: denotes P < 0.05 between Dahl R and Dahl S, #: denotes P < 0.05 in transcript abundance on normal and 4 week high salt diet in Dahl R, Dahl R: Dahl salt-resistant, Dahl S: Dahl salt-sensitive. All α ENaC transcript levels were normalized against the house keeping gene PgK. N = 6 rats/group and the results are the average of 3 independent experiments.

References

    1. Garty H, Benos DJ. Characteristics and regulatory mechanisms of the amiloride-blockable Na+ channel. Physiol Rev. 1988;68:309–373. - PubMed
    1. Benos DJ, Saccomani G, Brenner BM, Sariban-Sohraby S. Purification and characterization of the amiloride-sensitive sodium channel from A6 cultured cells and bovine renal papilla. Proc Natl Acad Sci USA. 1986;83:8525–8529. doi: 10.1073/pnas.83.22.8525. - DOI - PMC - PubMed
    1. Benos DJ, Saccomani G, Sariban-Sohraby S. The epithelial sodium channel. Subunit number and location of the amiloride binding site. J Biol Chem. 1987;262:10613–10618. - PubMed
    1. Benos DJ, Stanton BA. Functional domains within the degenerin/epithelial sodium channel (Deg/ENaC) superfamily of ion channels. J Physiol. 1999;520:631–644. doi: 10.1111/j.1469-7793.1999.00631.x. - DOI - PMC - PubMed
    1. Canessa CM, Horisberger JD, Schild L, Rossier BC. Expression cloning of the epithelial sodium channel. Kidney Int. 1995;48:950–955. doi: 10.1038/ki.1995.376. - DOI - PubMed

LinkOut - more resources